DEPTHLEVEL
DEPTHLEVEL
Trade Cards: Why Visual Trade History Changes How You Learn
A spreadsheet row cannot capture what a trade felt like. A visual card can — and that difference is what makes pattern recognition possible.
Read article→Know where dealers are positioned before SPX and Gold open. AI-read levels every session — plus a trade journal that tracks your real edge over time. Every Sunday, AI reviews your trades so you don't repeat the same mistakes.
Free during beta · 354 verified trades logged · No credit card
[ ANALYSIS ]
GEX Call Wall · 5,940
Dealer resistance active · range-bound regime
4 trades pulled from MT5
Weekly report is ready
R-VALUE SCORE
+2.4R
avg · last 30 trades
[ SYNC & IMPORT ]




[ WHAT'S INSIDE ]
From pre-session Sentinel maps to post-trade R-value review — one workspace built around the workflow that compounds over time.
[ SENTINEL ENGINE ]
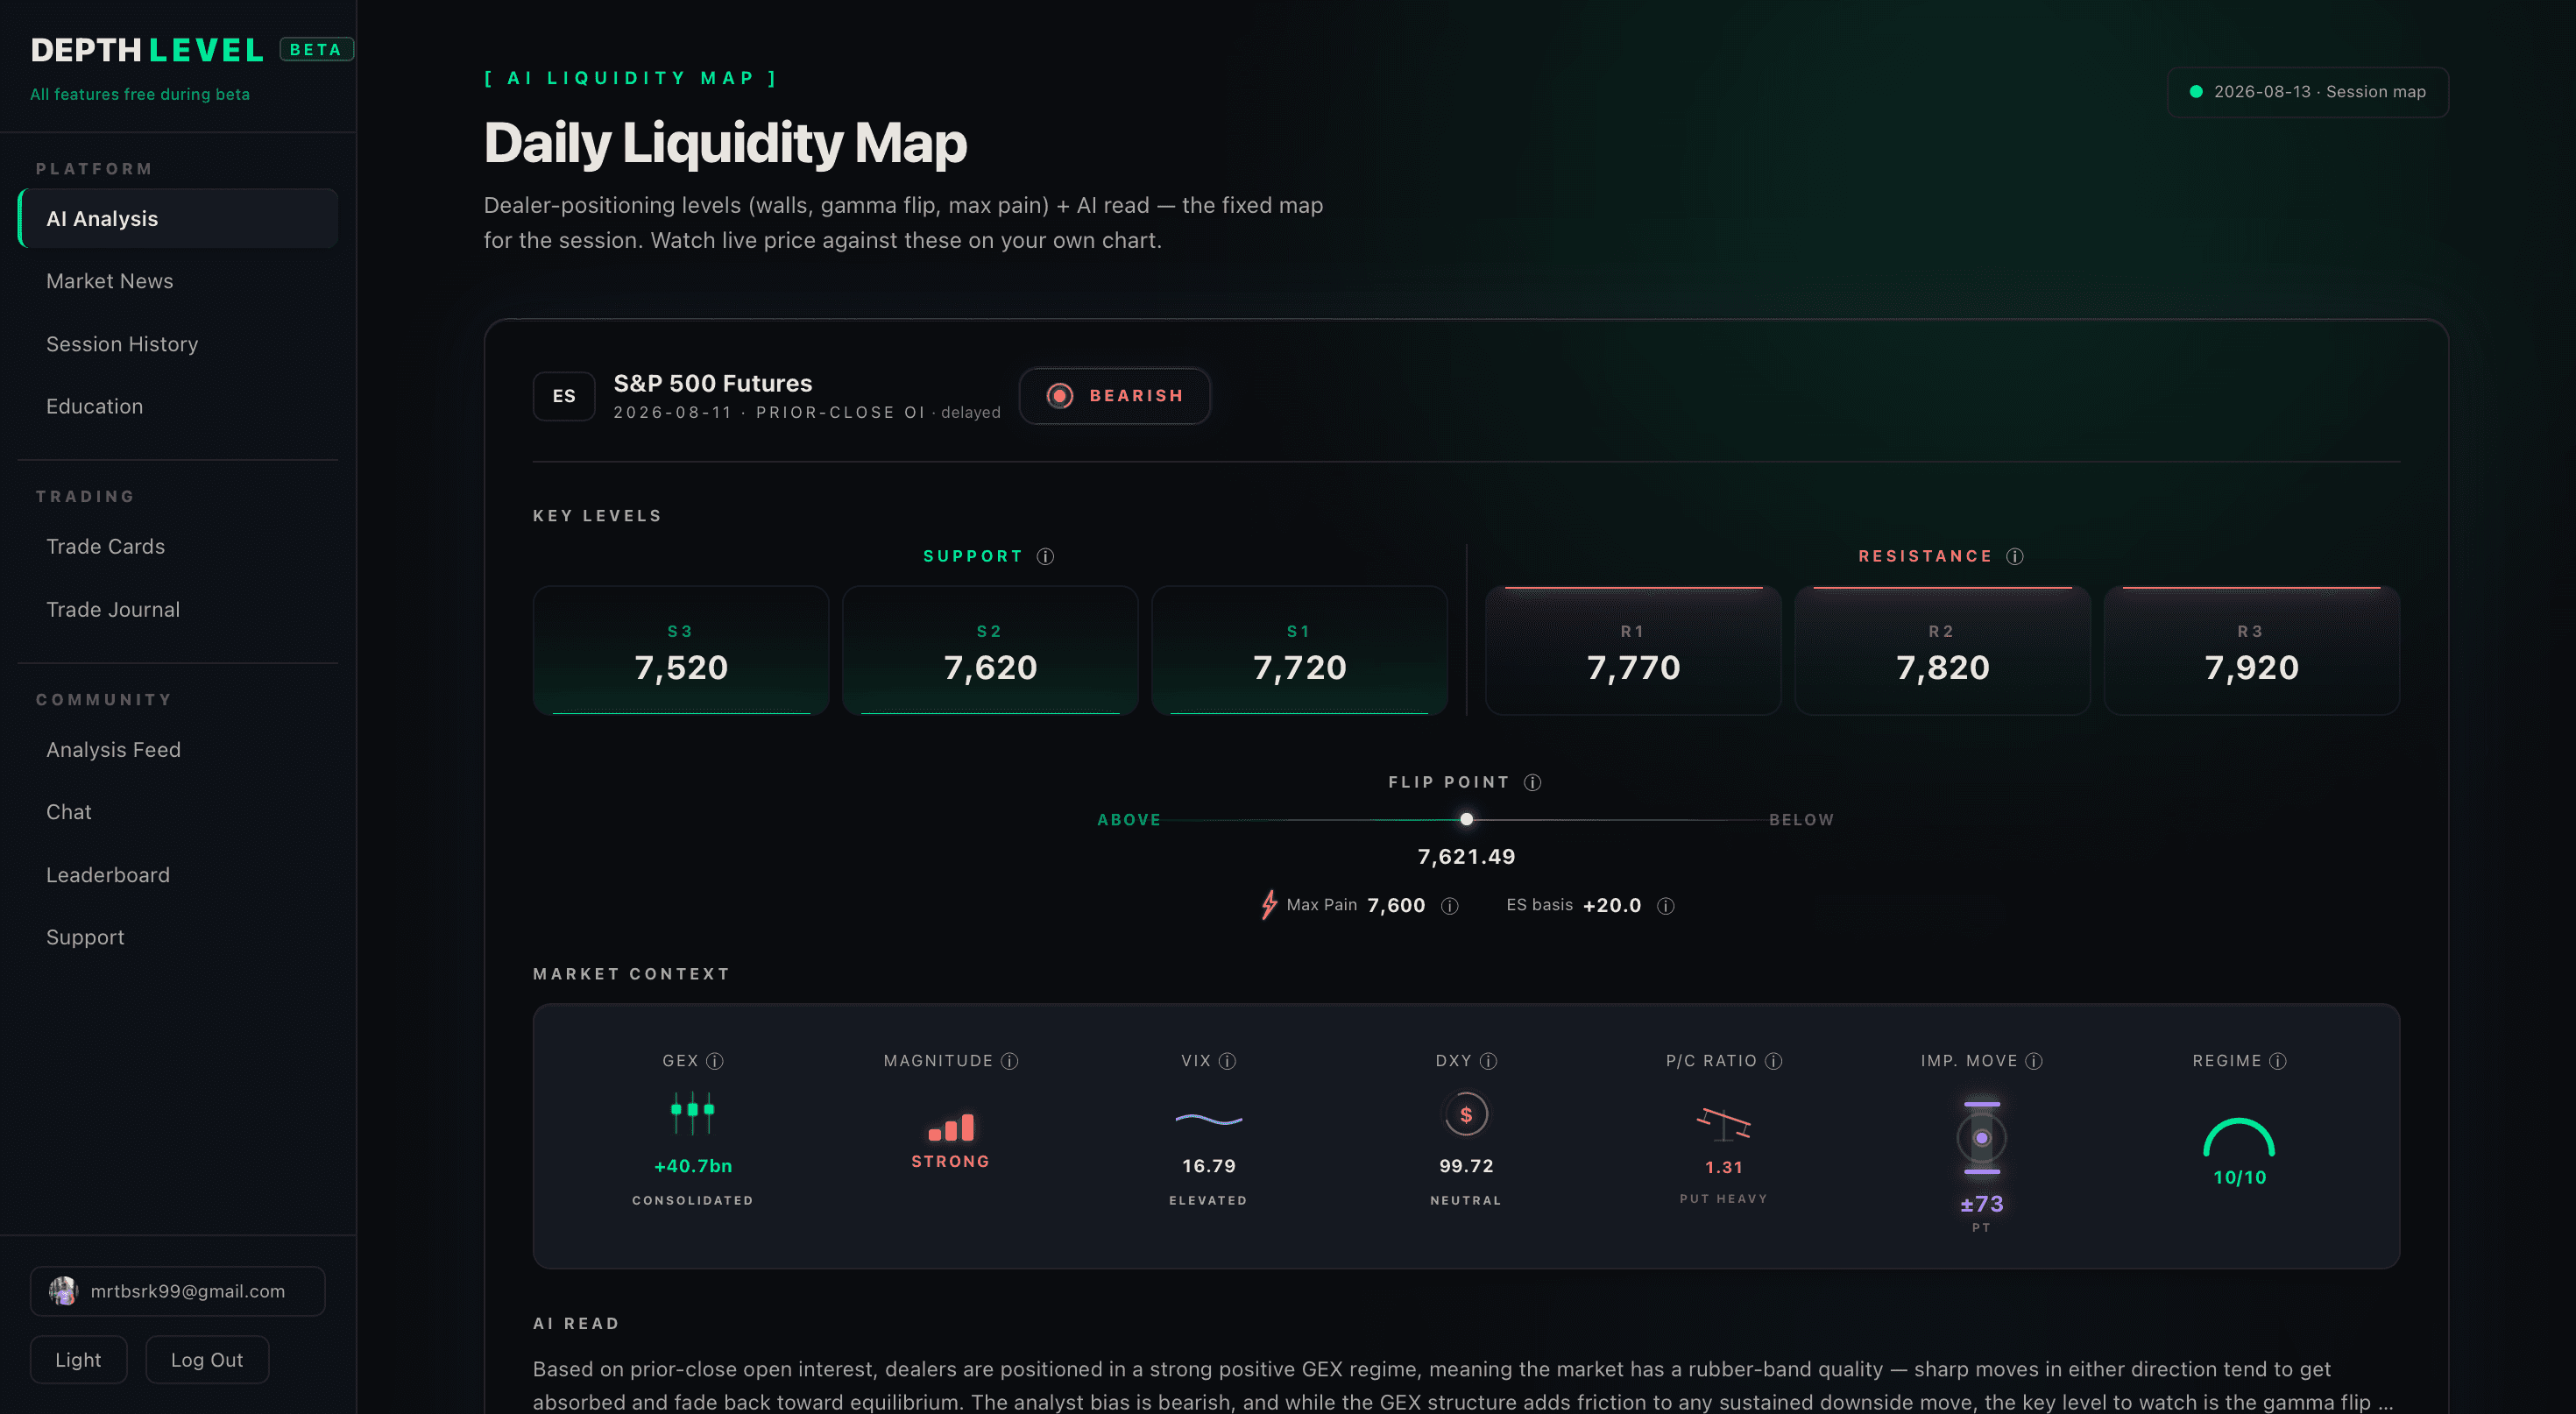
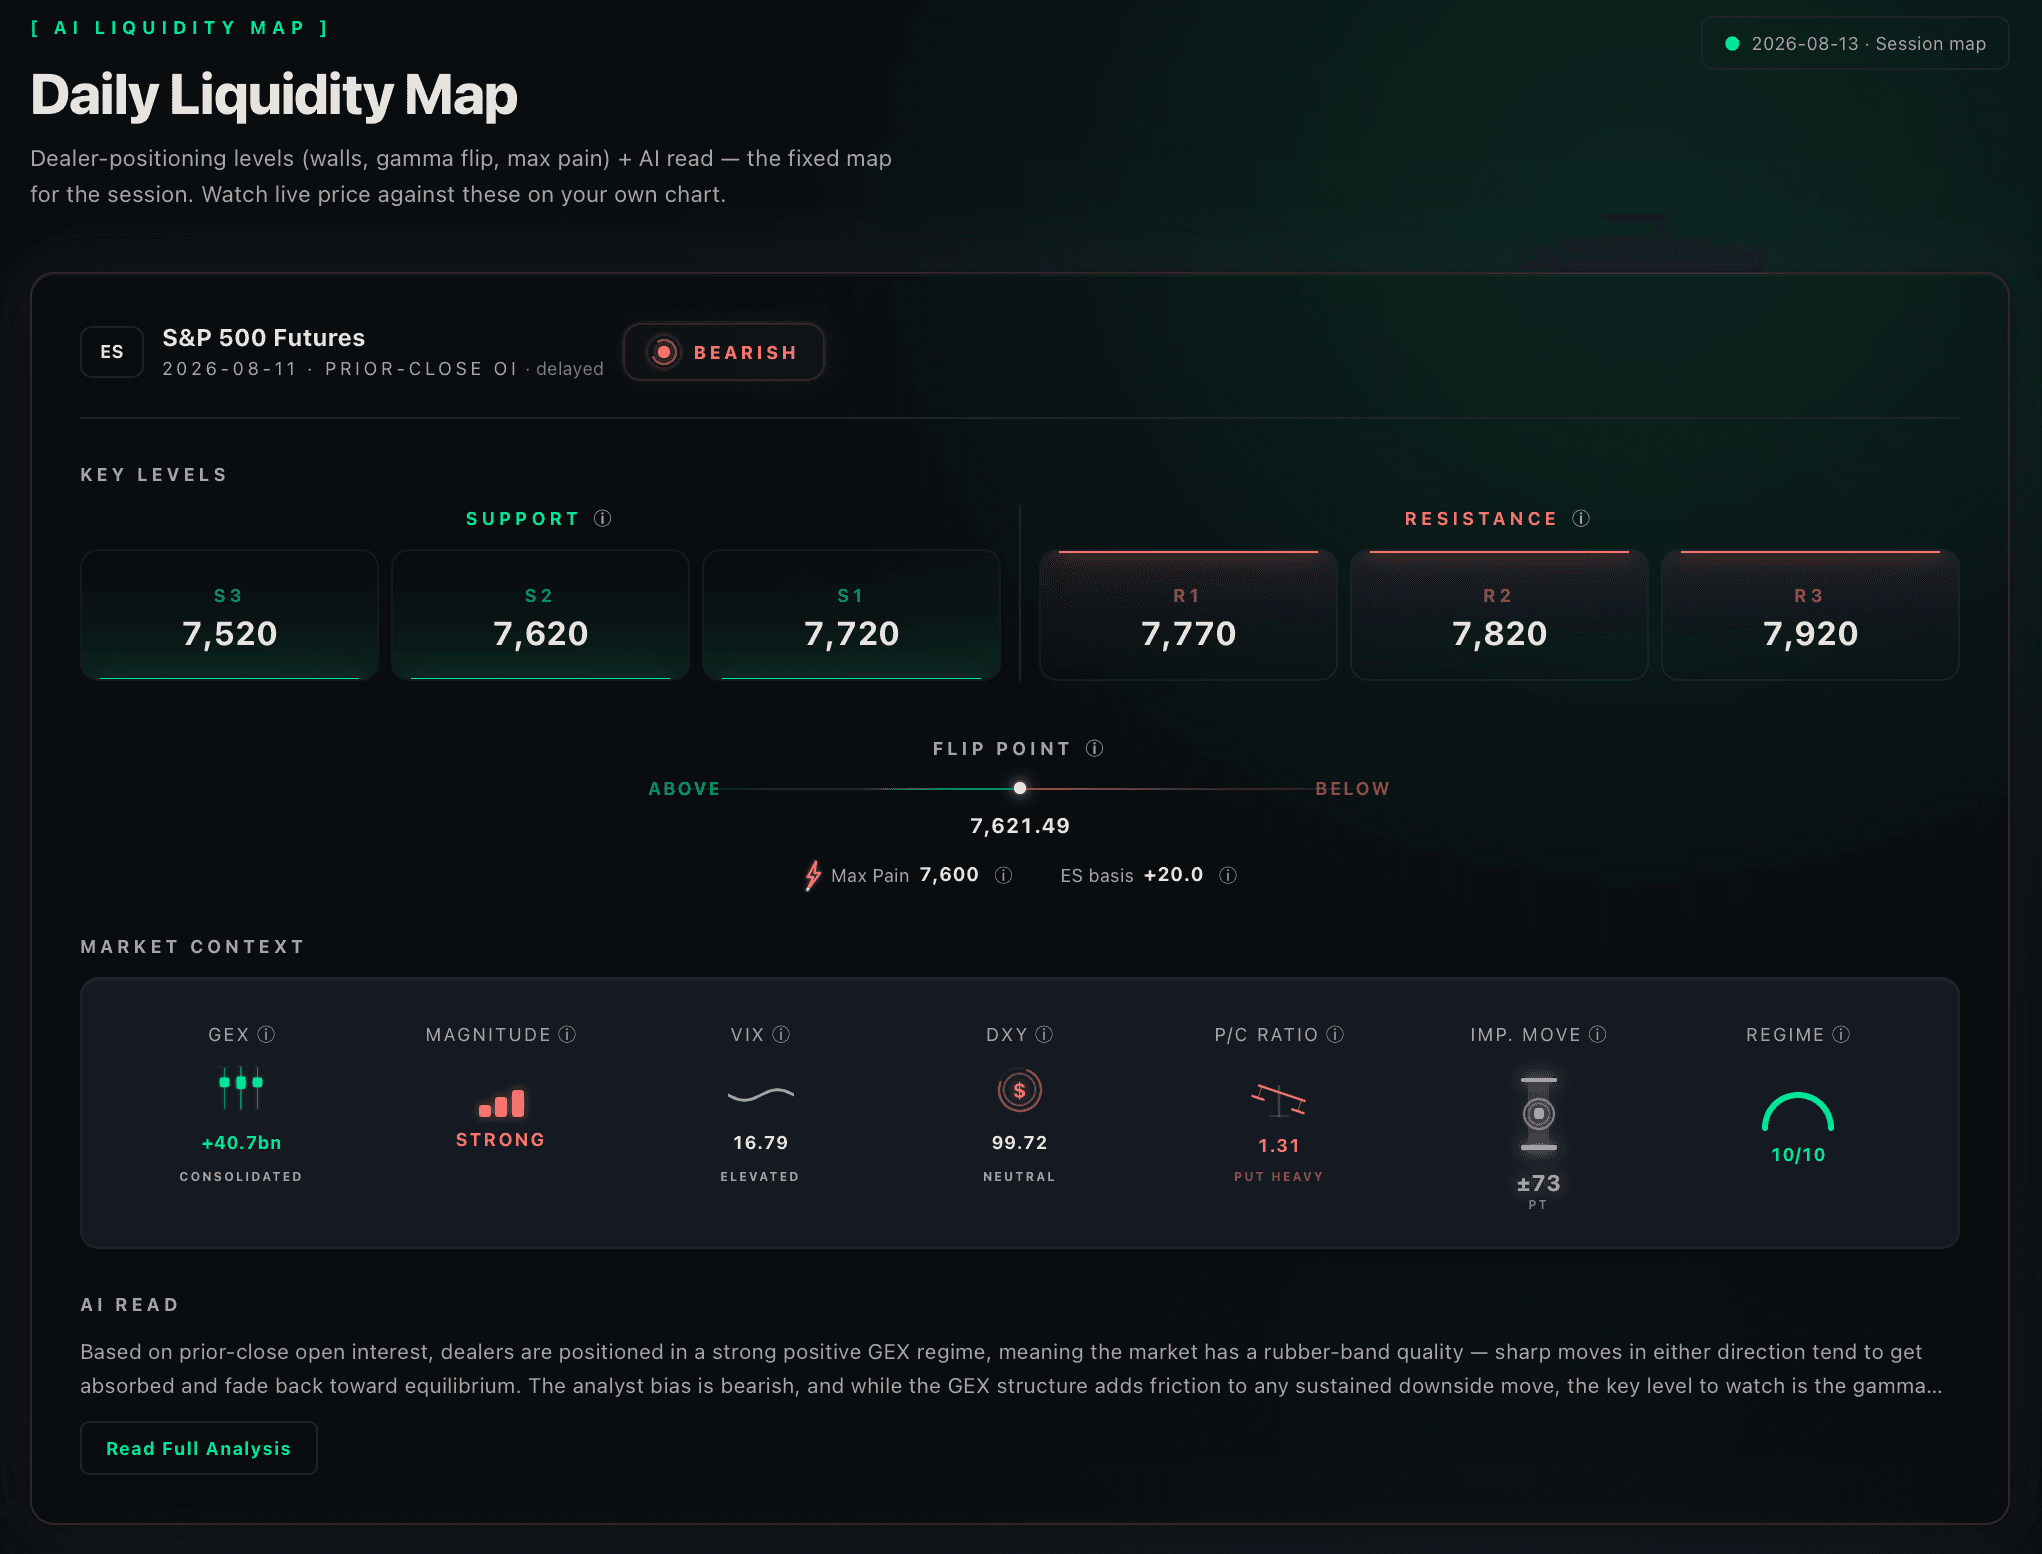
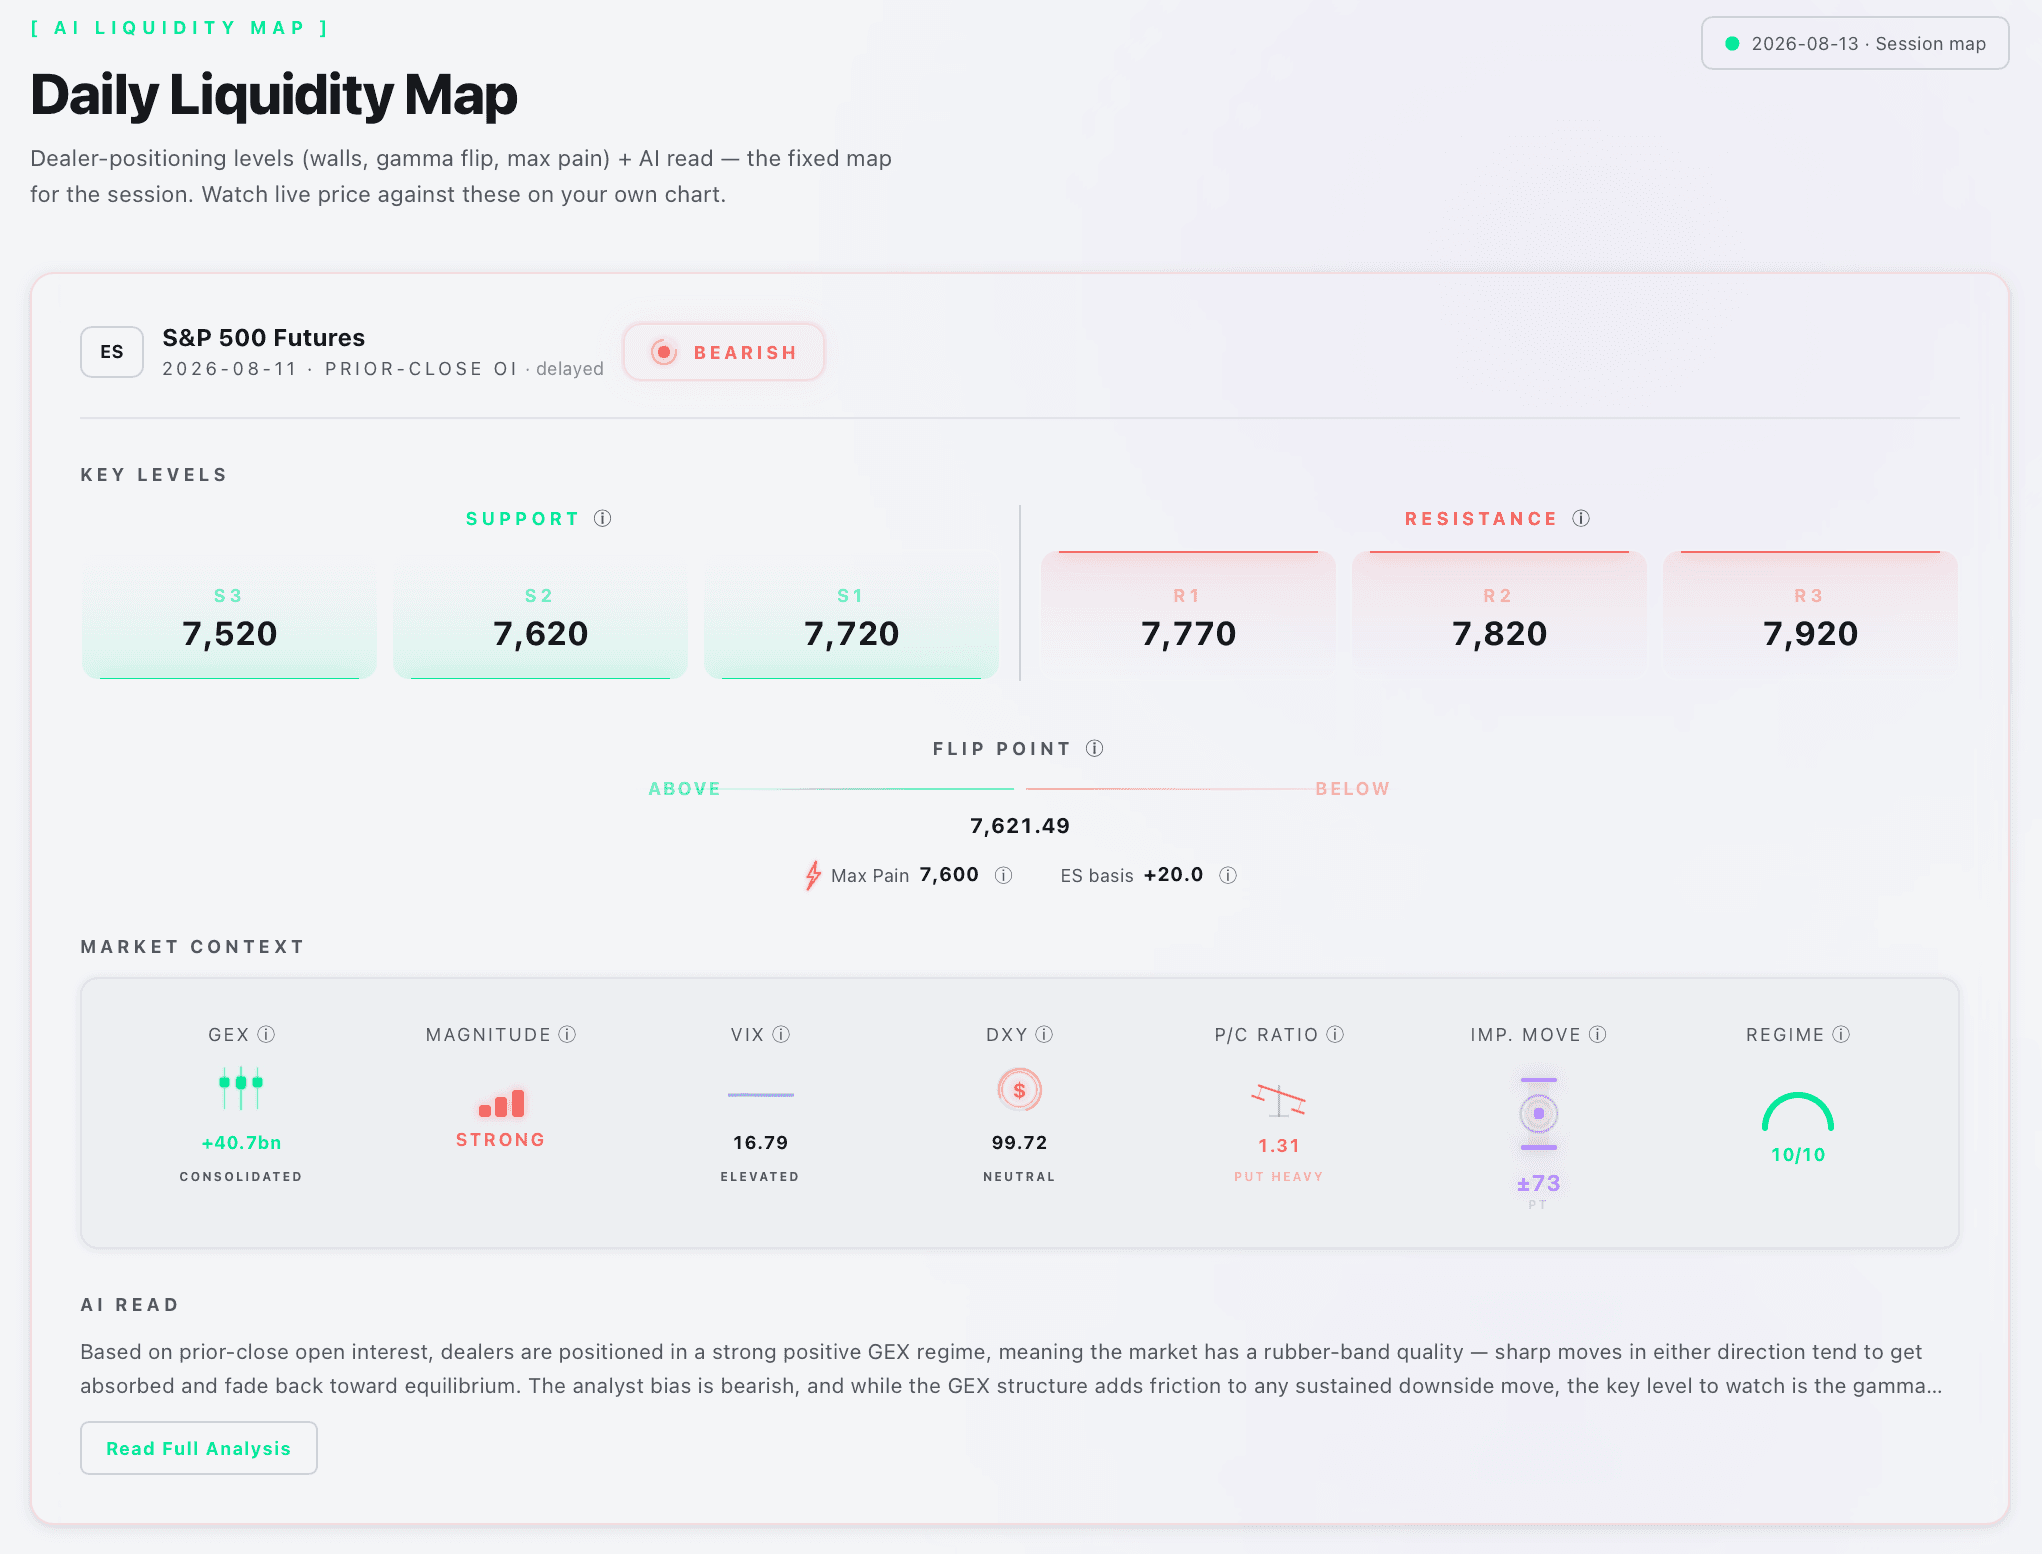
The Sentinel engine maps dealer gamma positioning across the entire SPX and Gold options chain every session. Flip zone, call/put walls, max pain, implied move — delivered before the open.
[ SENTINEL vs. EVERYTHING ELSE ]
GEX analysis requires raw options chain data and the math to parse it. That's not something you can get from a web search — and it's exactly what Sentinel runs on.
[ MARKET FUEL ]
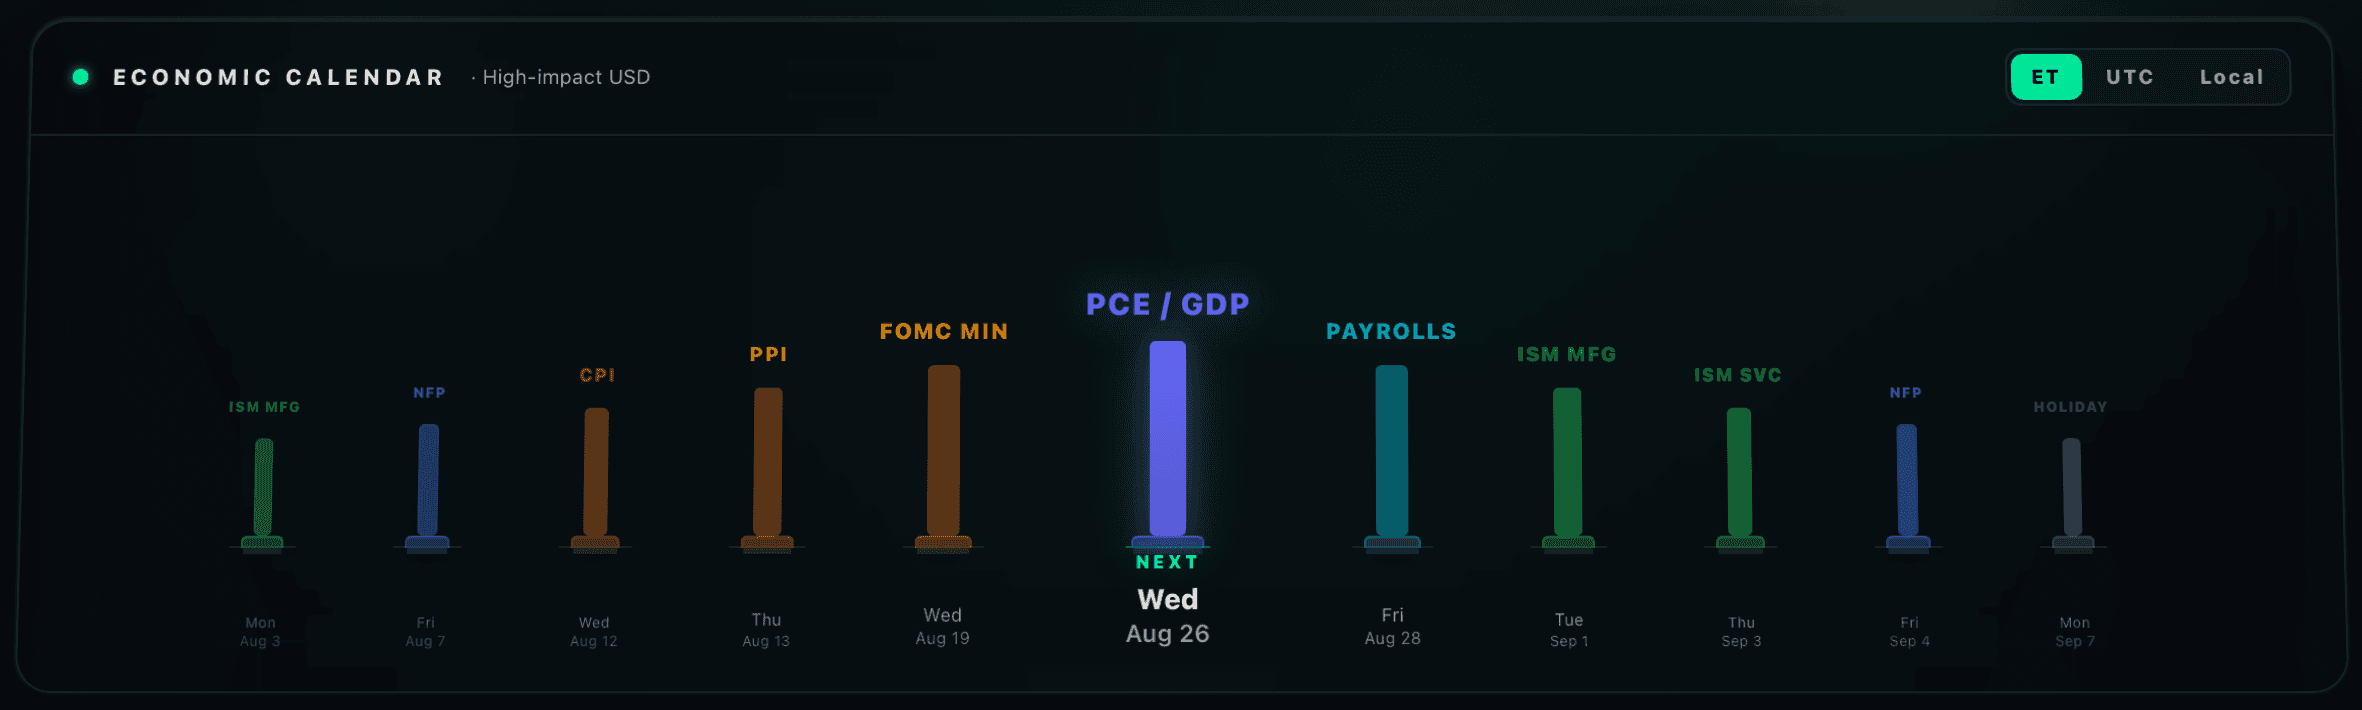
Every high-impact release broken down for Gold and SPX — not just the number, but the directional bias. Know whether a 57K NFP miss is bullish or bearish before the market makes up its mind.
[ NFP · CPI · FED ]
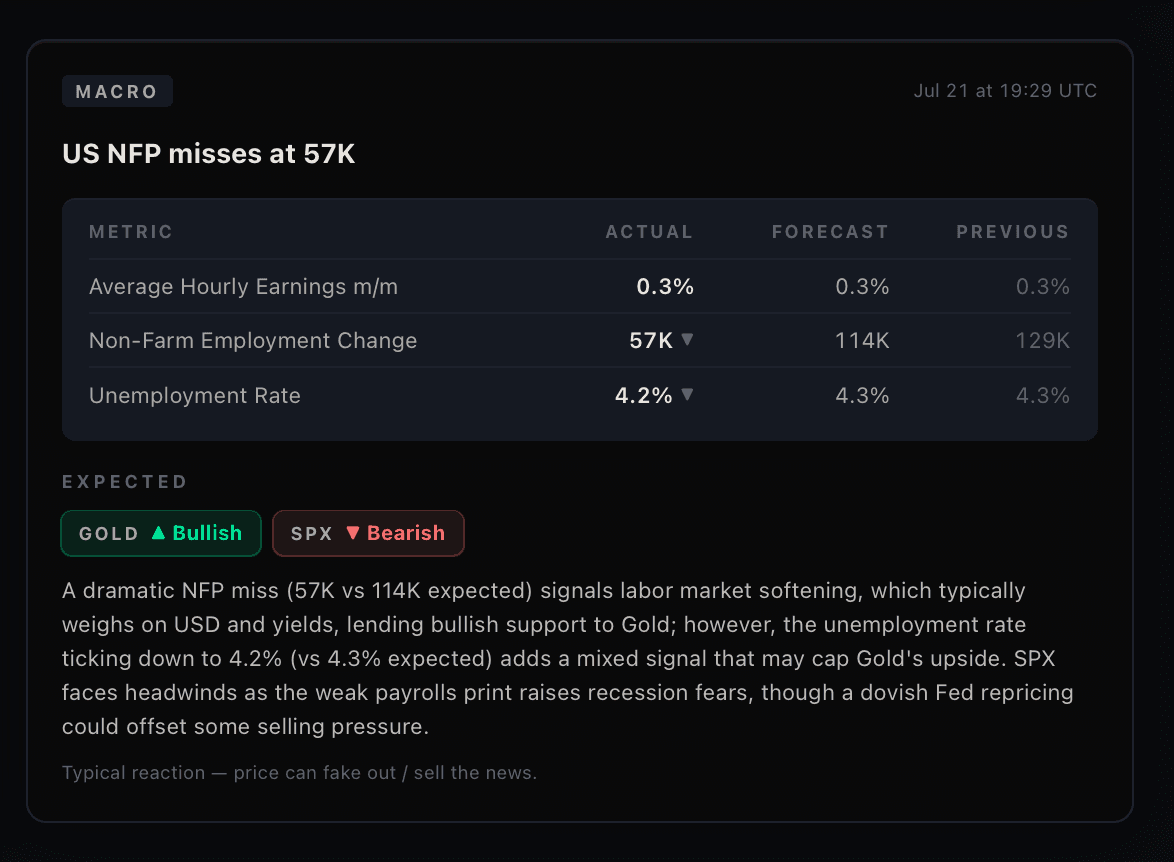
[ NFP ]
The number drops. You know what it means.
Non-Farm Payrolls — actual vs forecast, directional bias for Gold and S&P. Know whether a 57K miss is bullish or bearish before the algos decide.
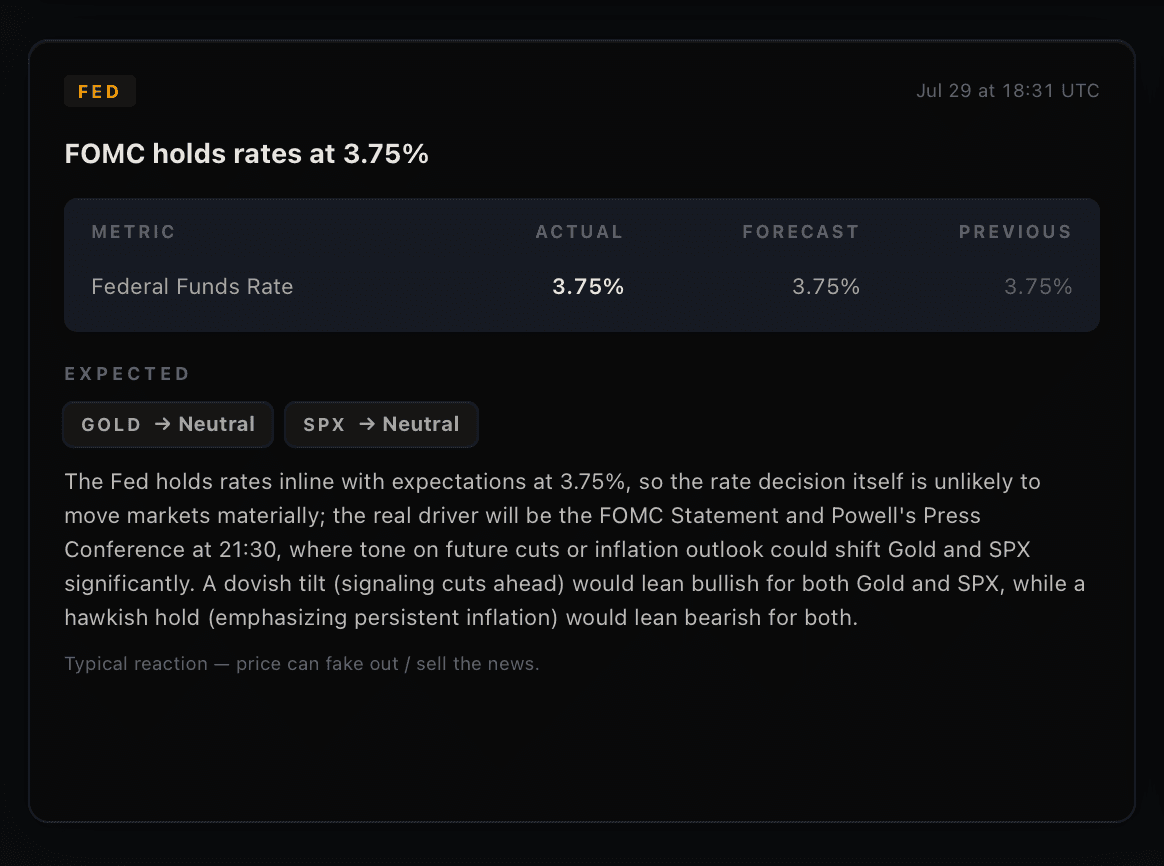
[ FED · CPI · FOMC ]
Rate decisions decoded before the session opens.
Fed meetings, CPI prints, FOMC minutes — what changed, what it means for risk assets, and the one thing to watch next session.
[ TRADE CARDS ]
Every trade auto-generates a collectible card — tier assigned from R-value. Better execution, rarer card. Drag to explore all 11 tiers.
[ COLLECTION STATS ]
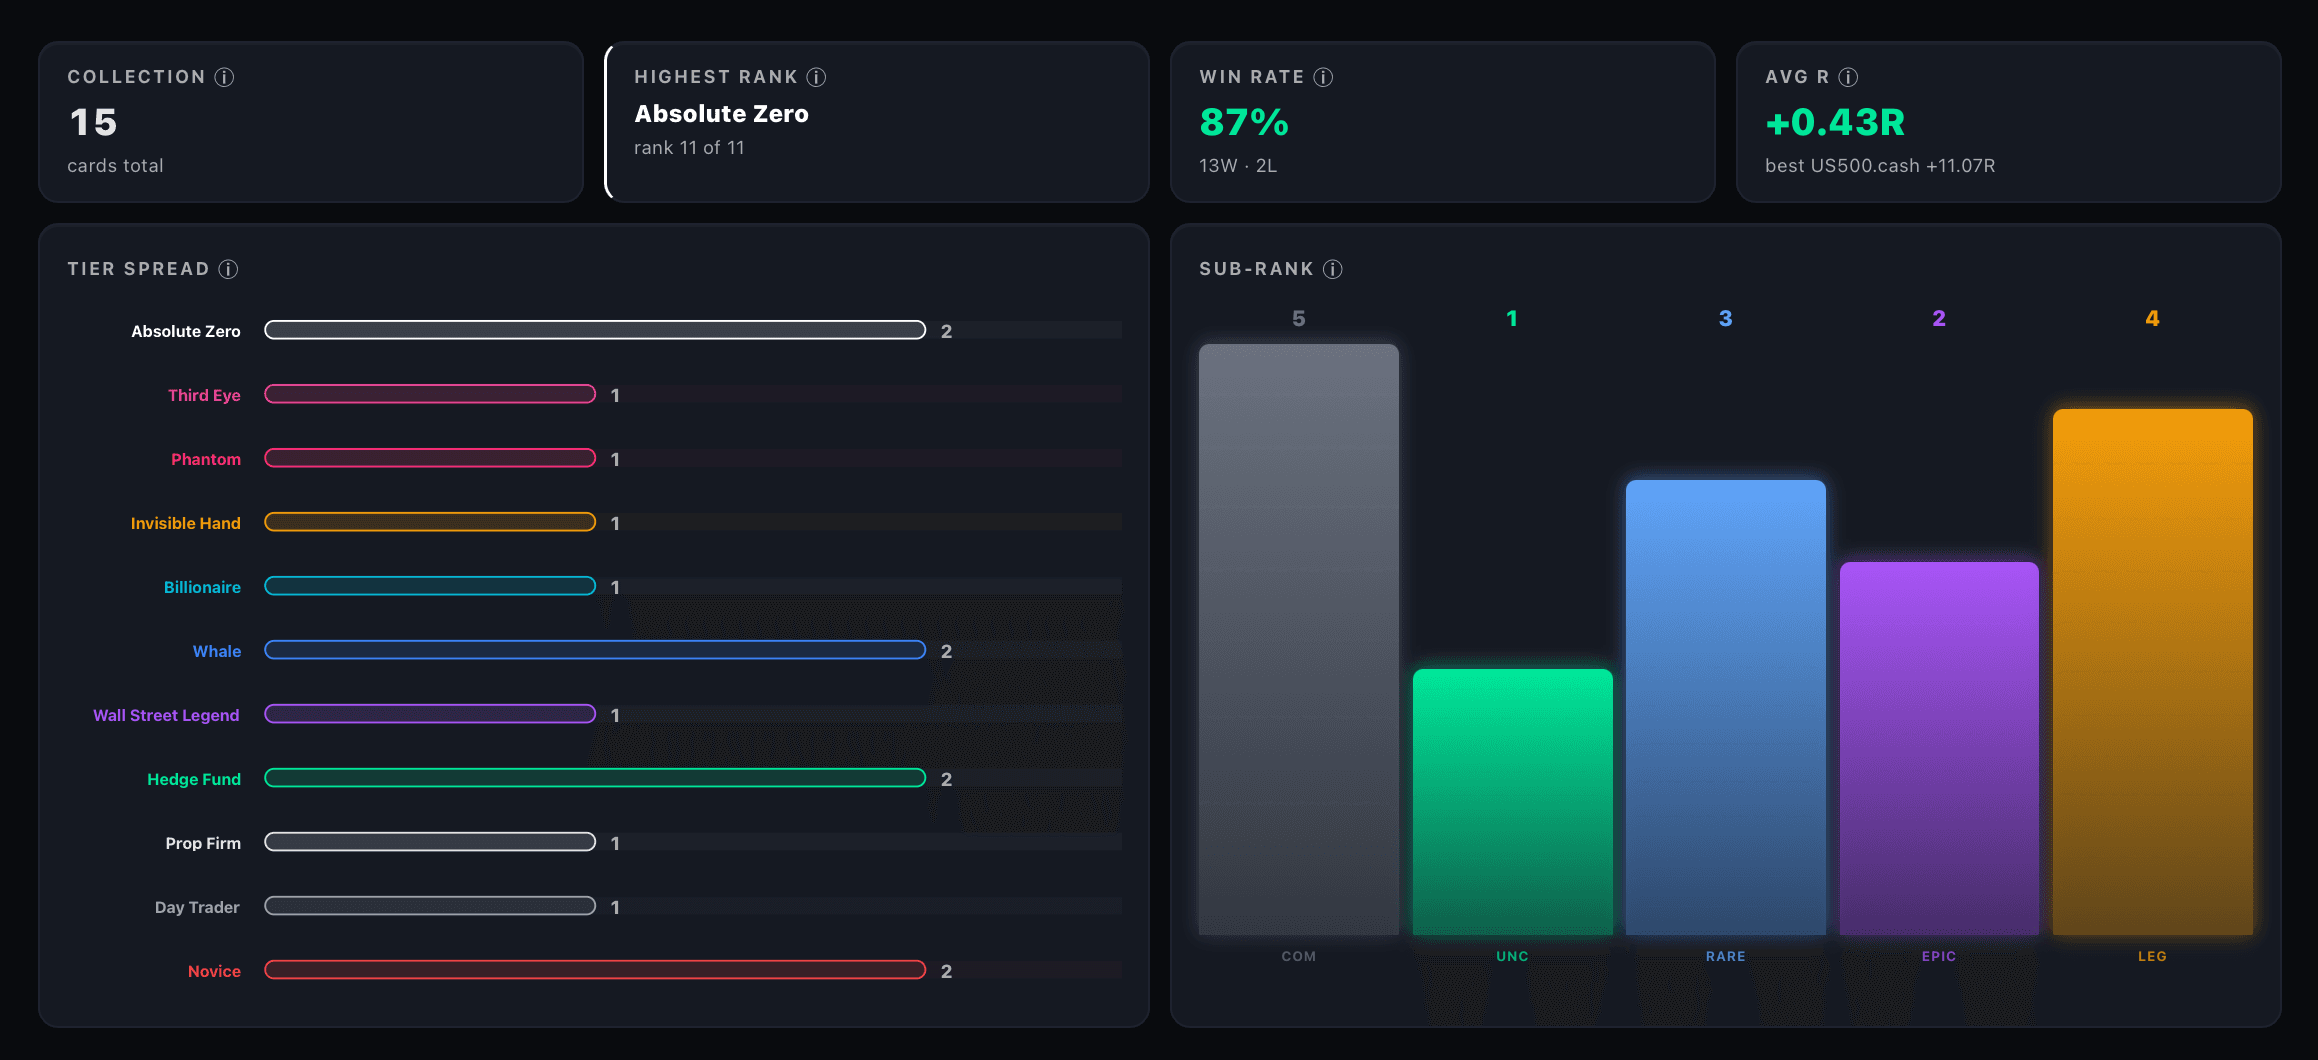
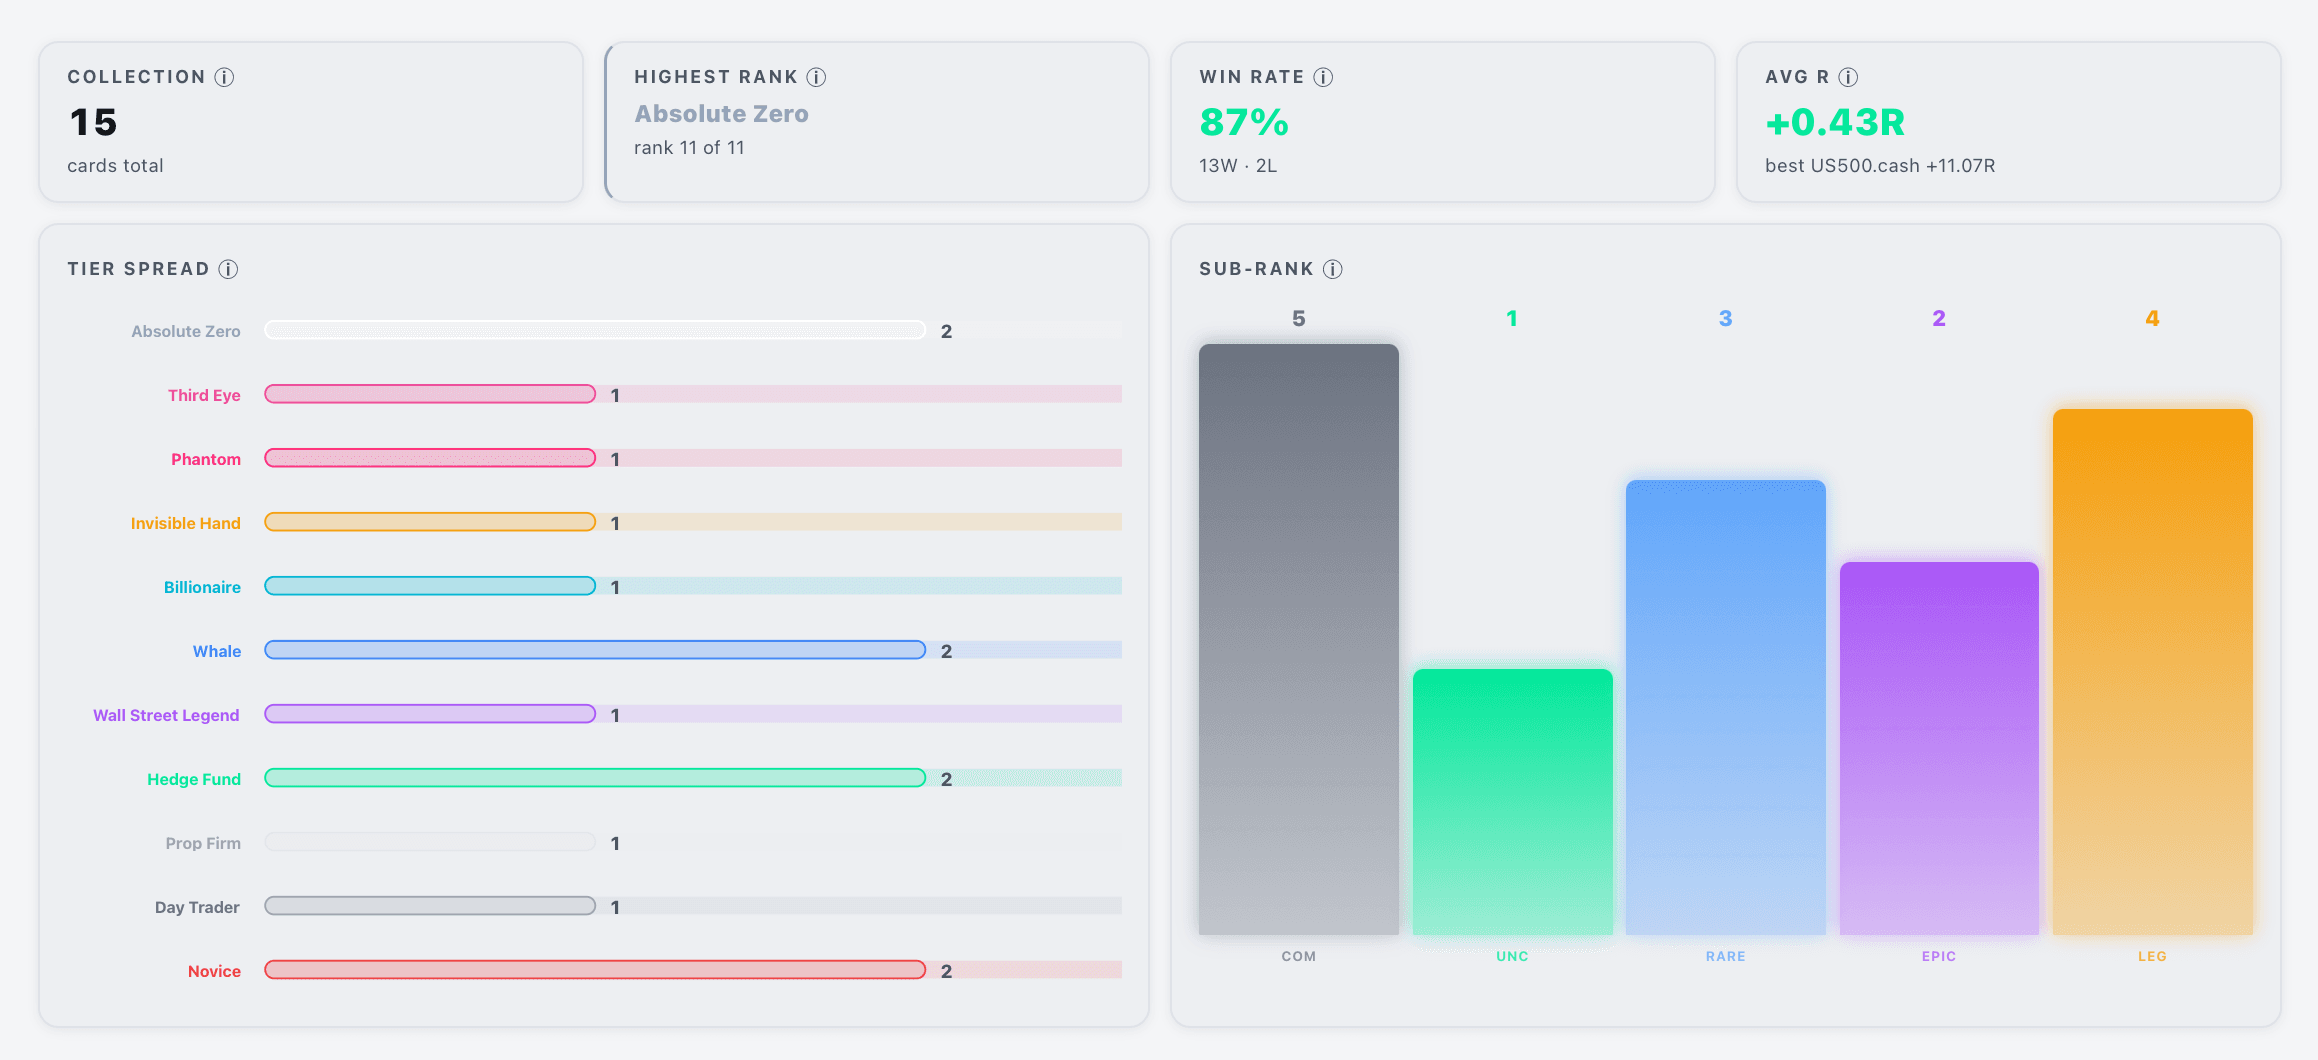
CARD HALL / LIVE
Every trade earns a card. Every card earns a rank. Broker-verified — no manual input, no self-reporting.
0
TRADERS
0
CARDS
11
TIERS
[ TOP COLLECTORS ]
RiskUnit
Deniz Y.
Hasan D.
Min 10 cards · Ranked by total card count
Free during beta · cTrader, MT4 & MT5 auto-sync
[ TRADE JOURNAL ]
Log, analyze, and understand every trade. Broker sync, R-values, pattern detection — all in one place.
[ TRADE JOURNAL ]
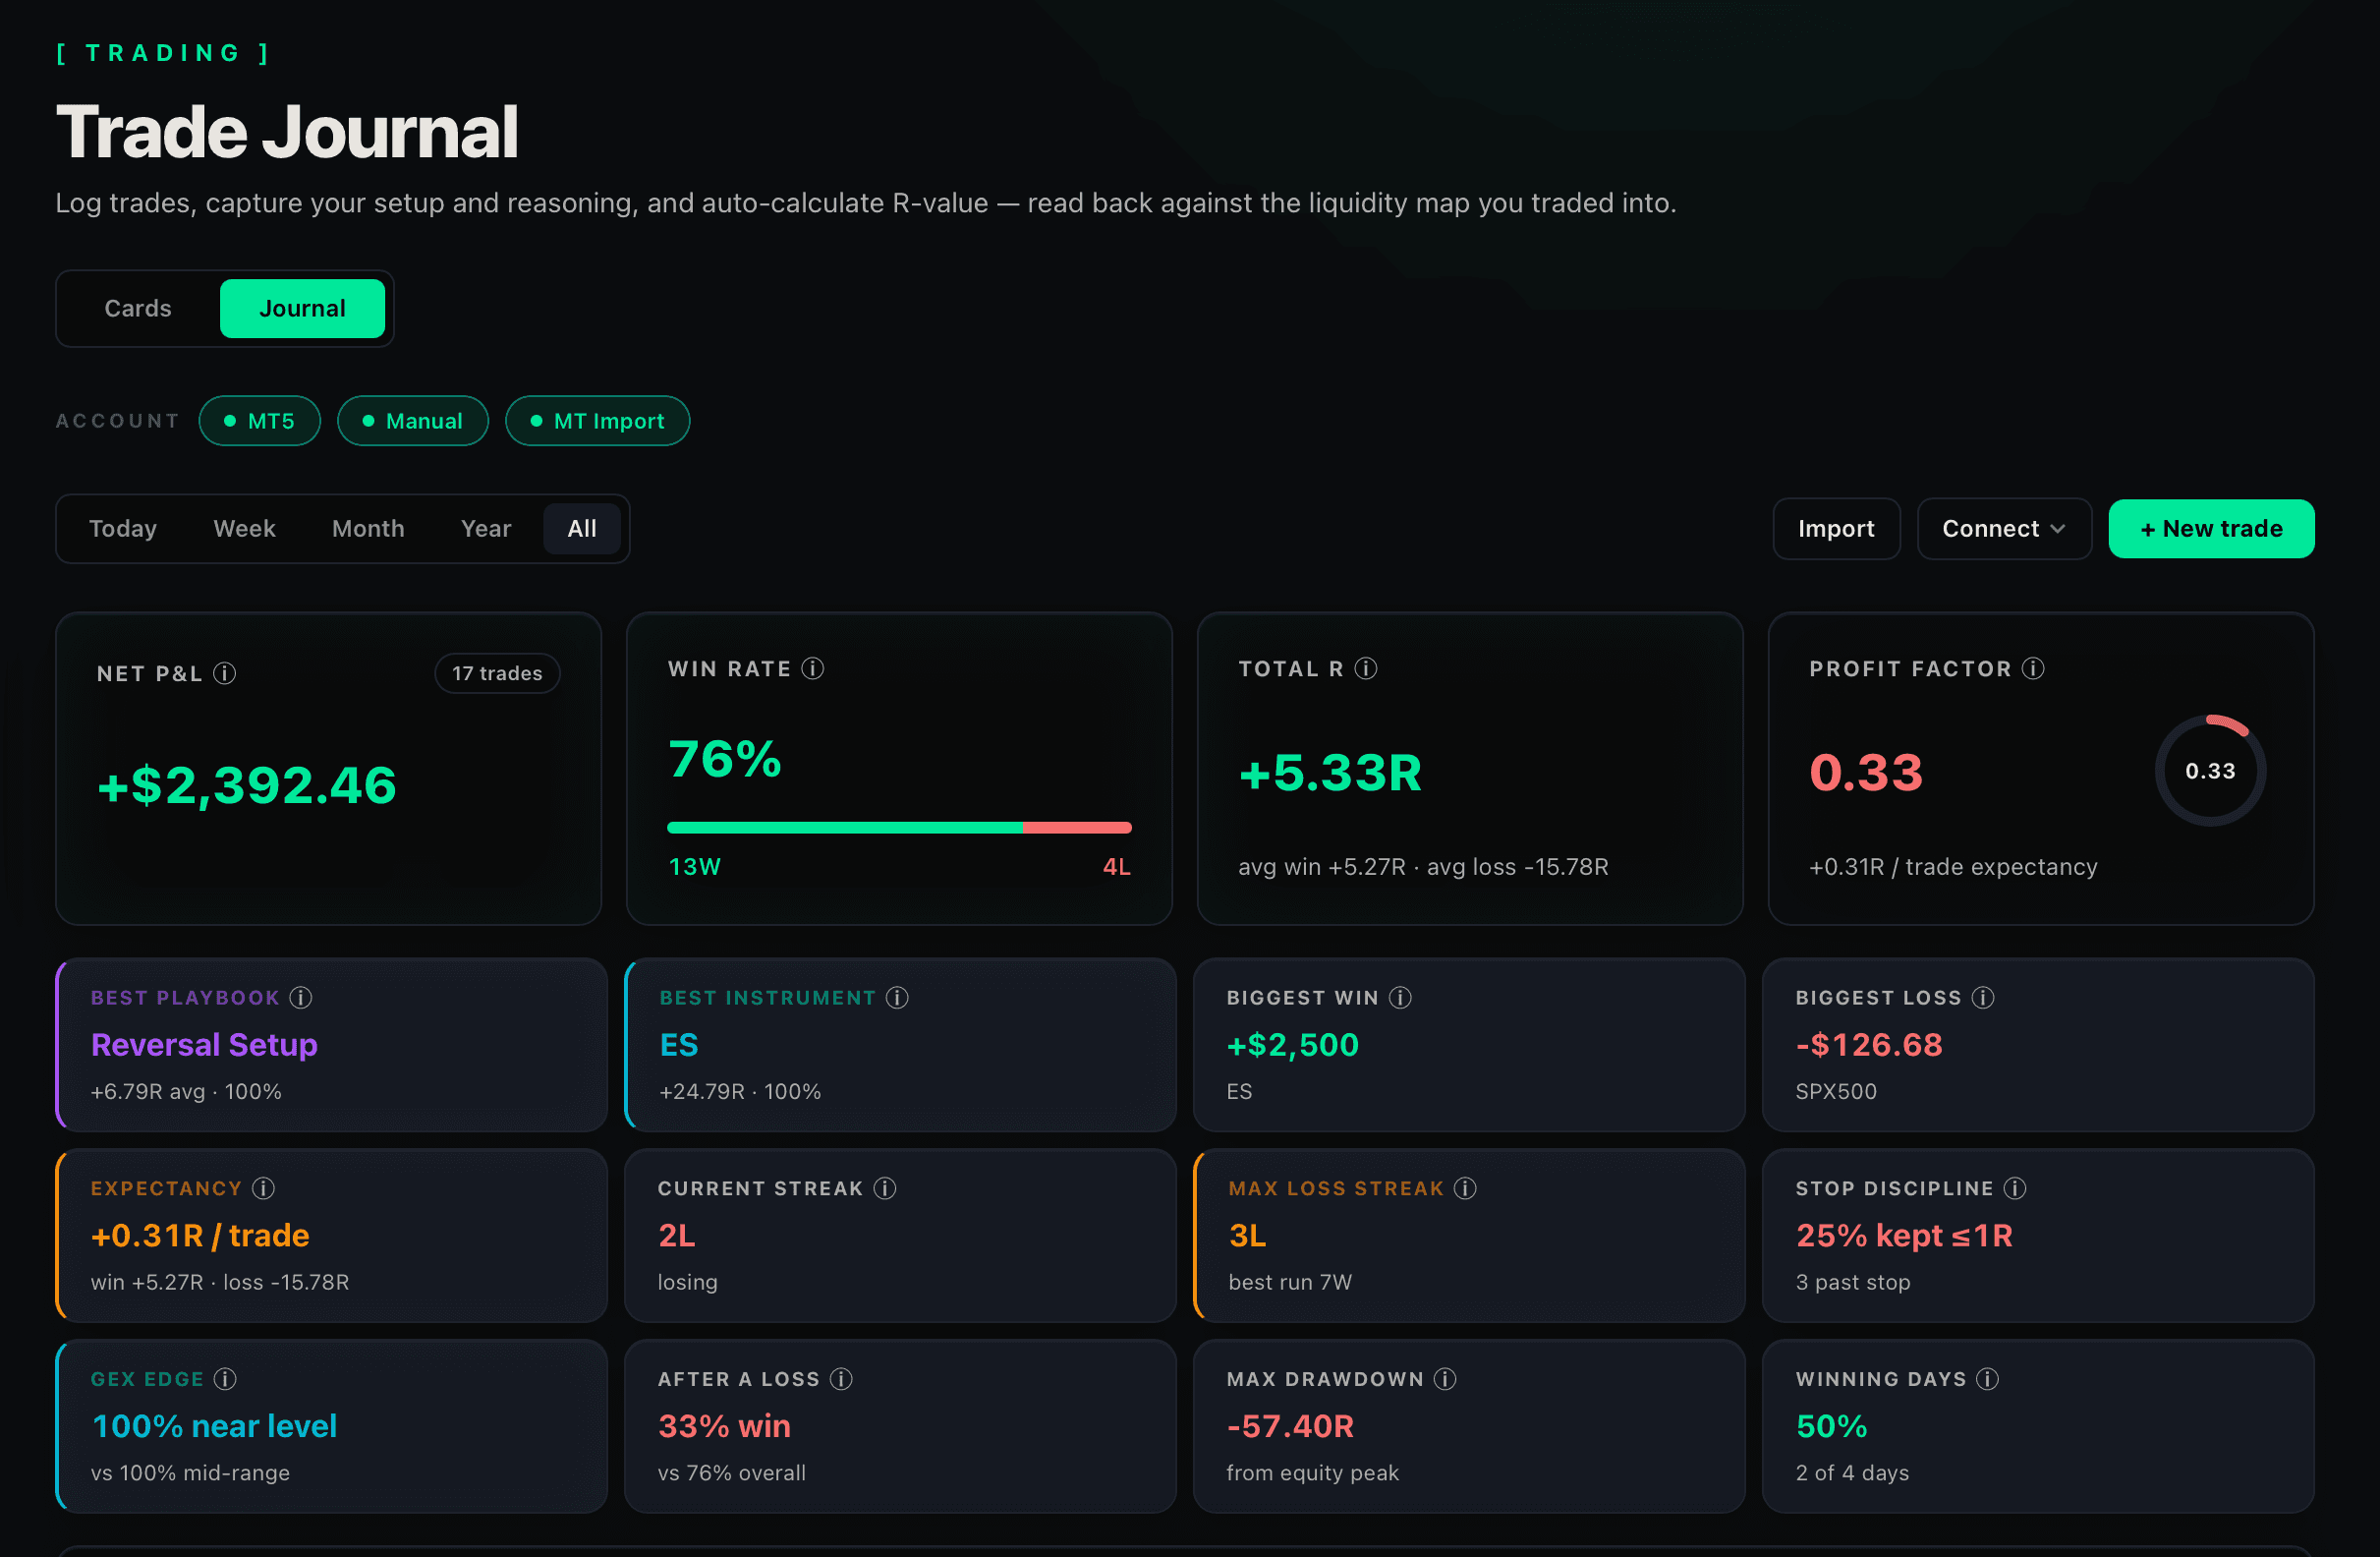
Next-gen trade logging.
R-value, tier, setup tag per trade. Win rate, avg R and profit factor auto-calculated. Connect your broker — trades flow in automatically.
[ TRADE CALENDAR ]
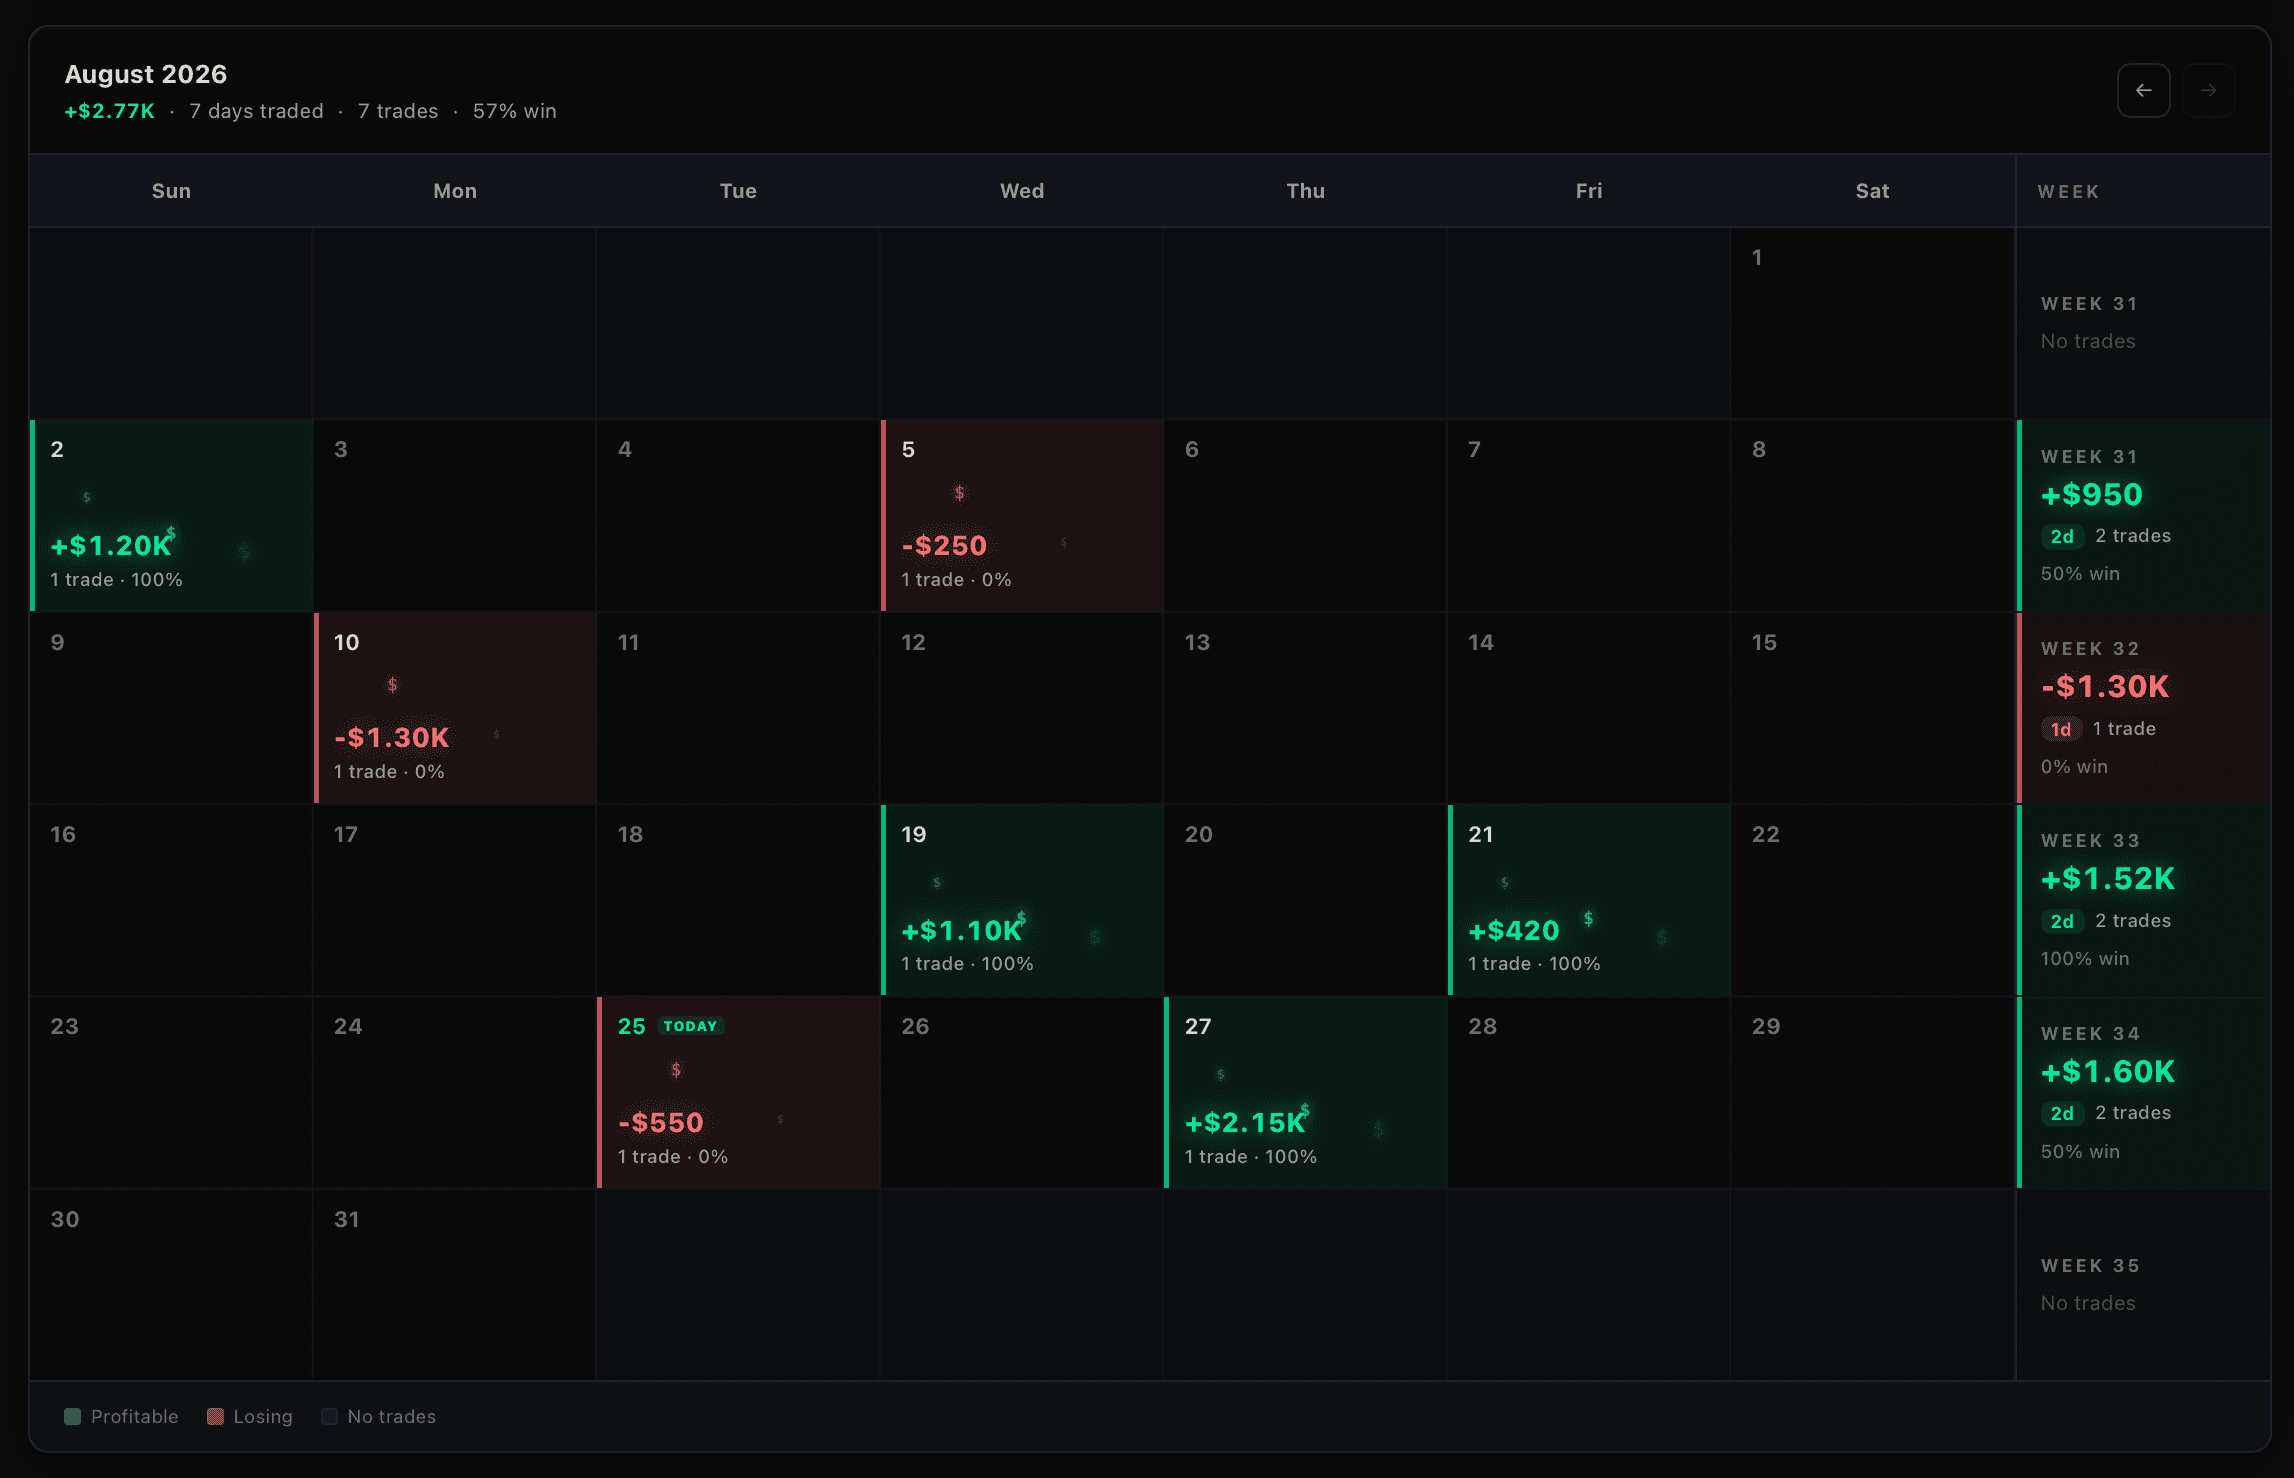
Profitable weeks aren't random.
Every trading day mapped by P&L and win rate. See at a glance when you're sharp — and when to sit on your hands.
[ EQUITY CURVE ]
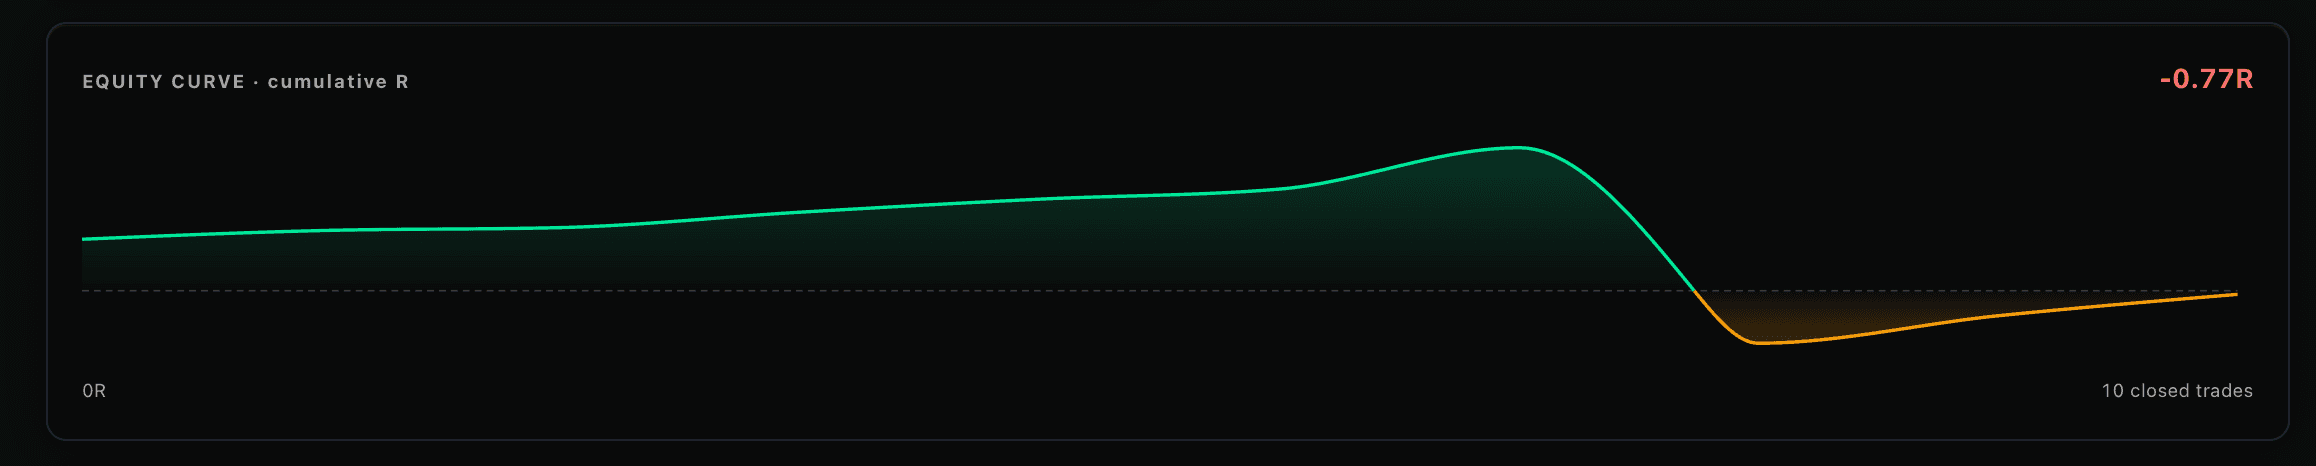
The honest shape of your edge over time.
Every trade stacks on a single cumulative R curve. No cherry-picking. No hiding the ugly sessions. The only number that doesn't lie.
[ AI JOURNAL COACH ]
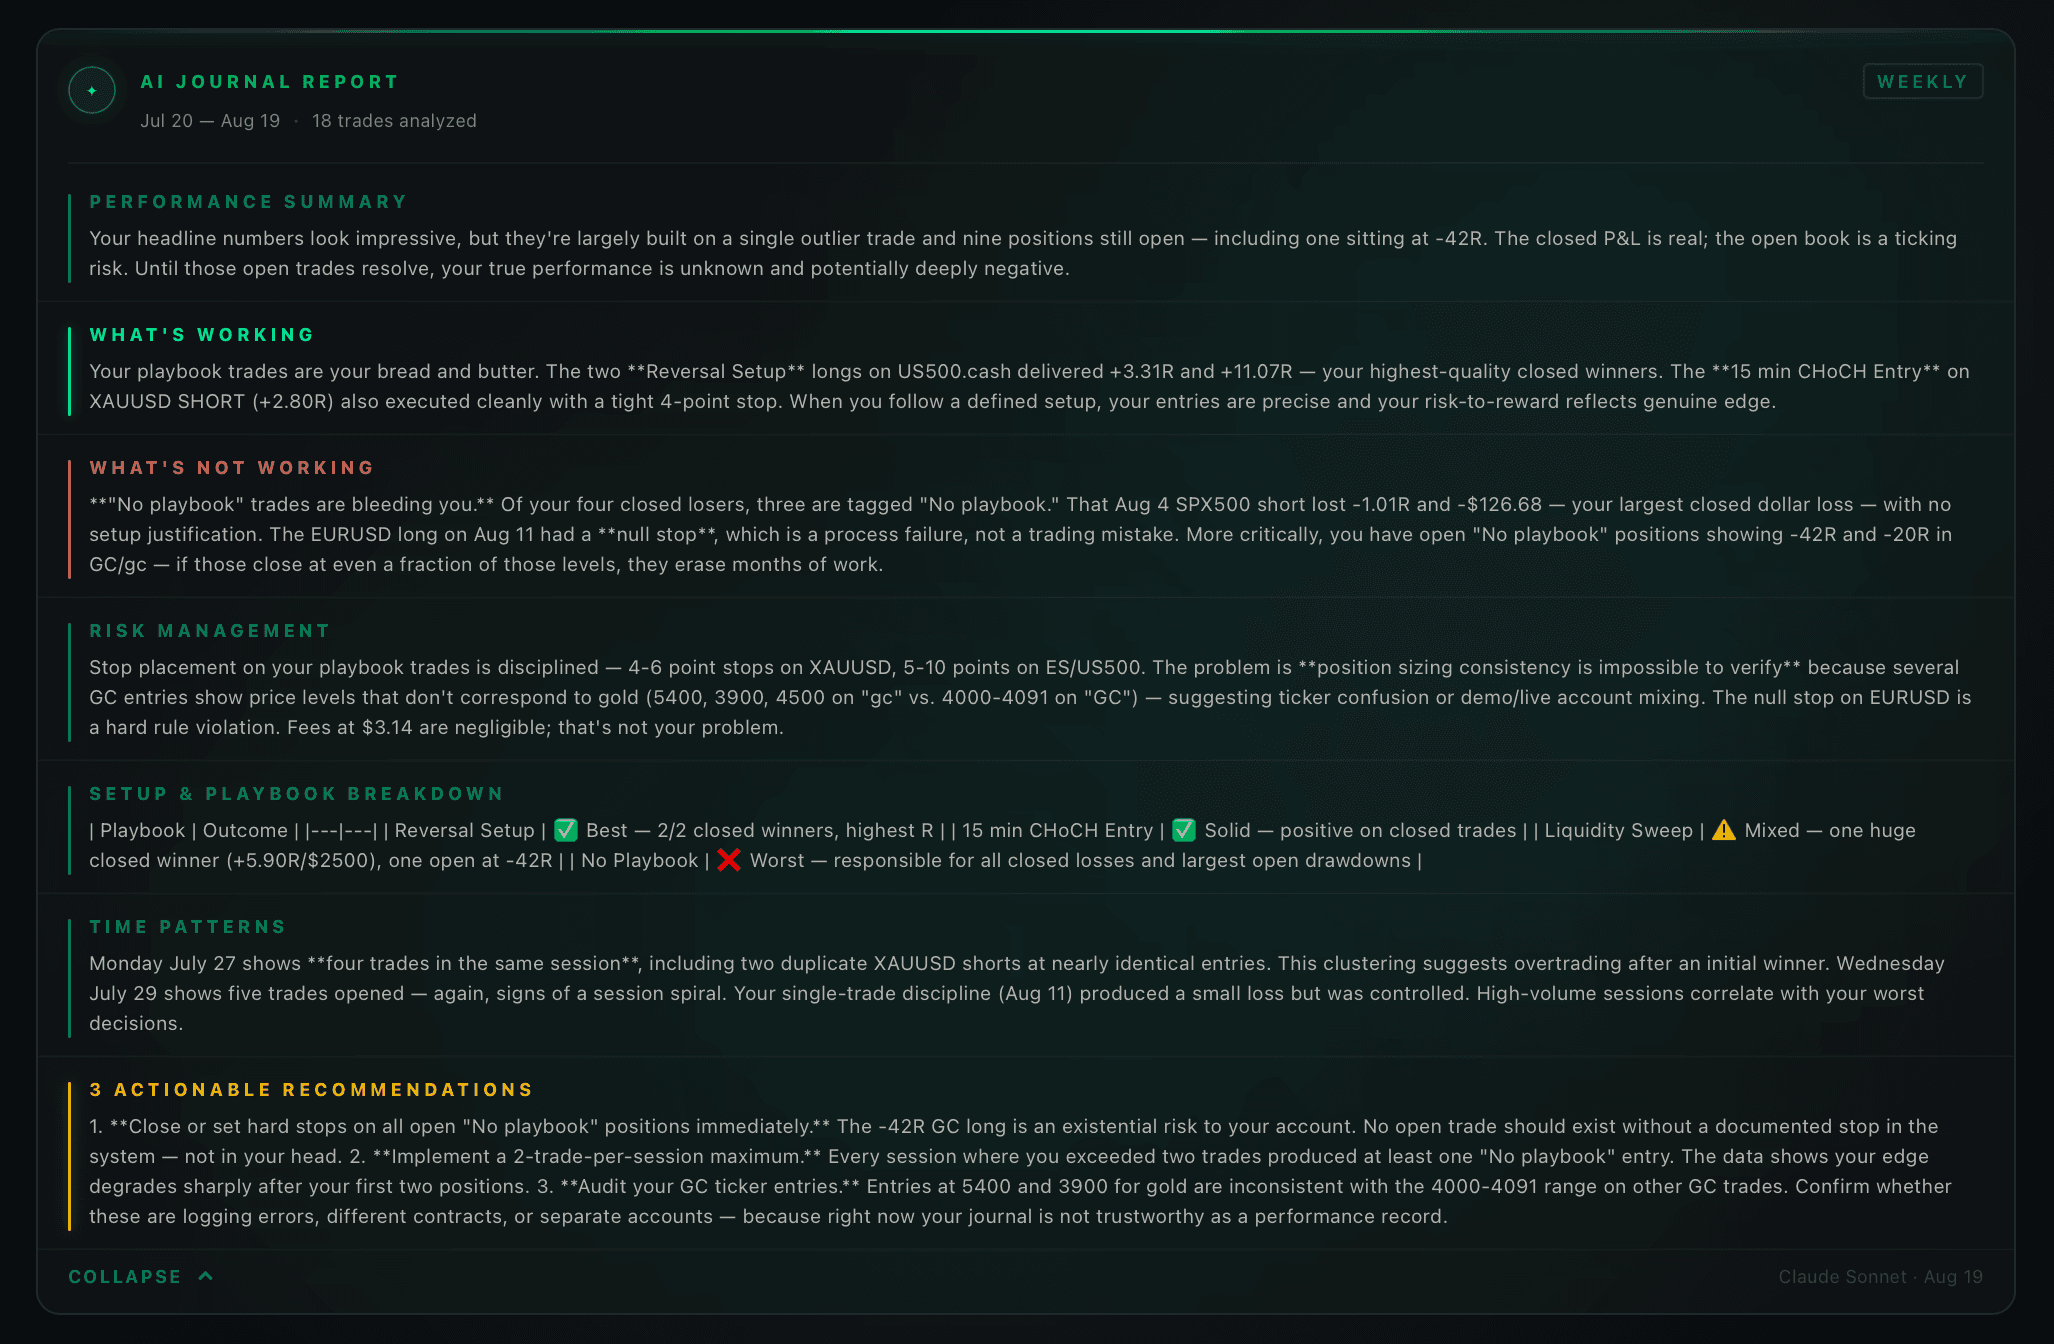
Every Sunday, AI reads your journal so you don't repeat the same mistakes.
30 days of trades. Win rate, risk patterns, playbook breakdown, time-of-day habits. 3 specific recommendations — based only on your data, not generic advice. Automatic. Free during beta.
▋
[ SESSION HISTORY ]
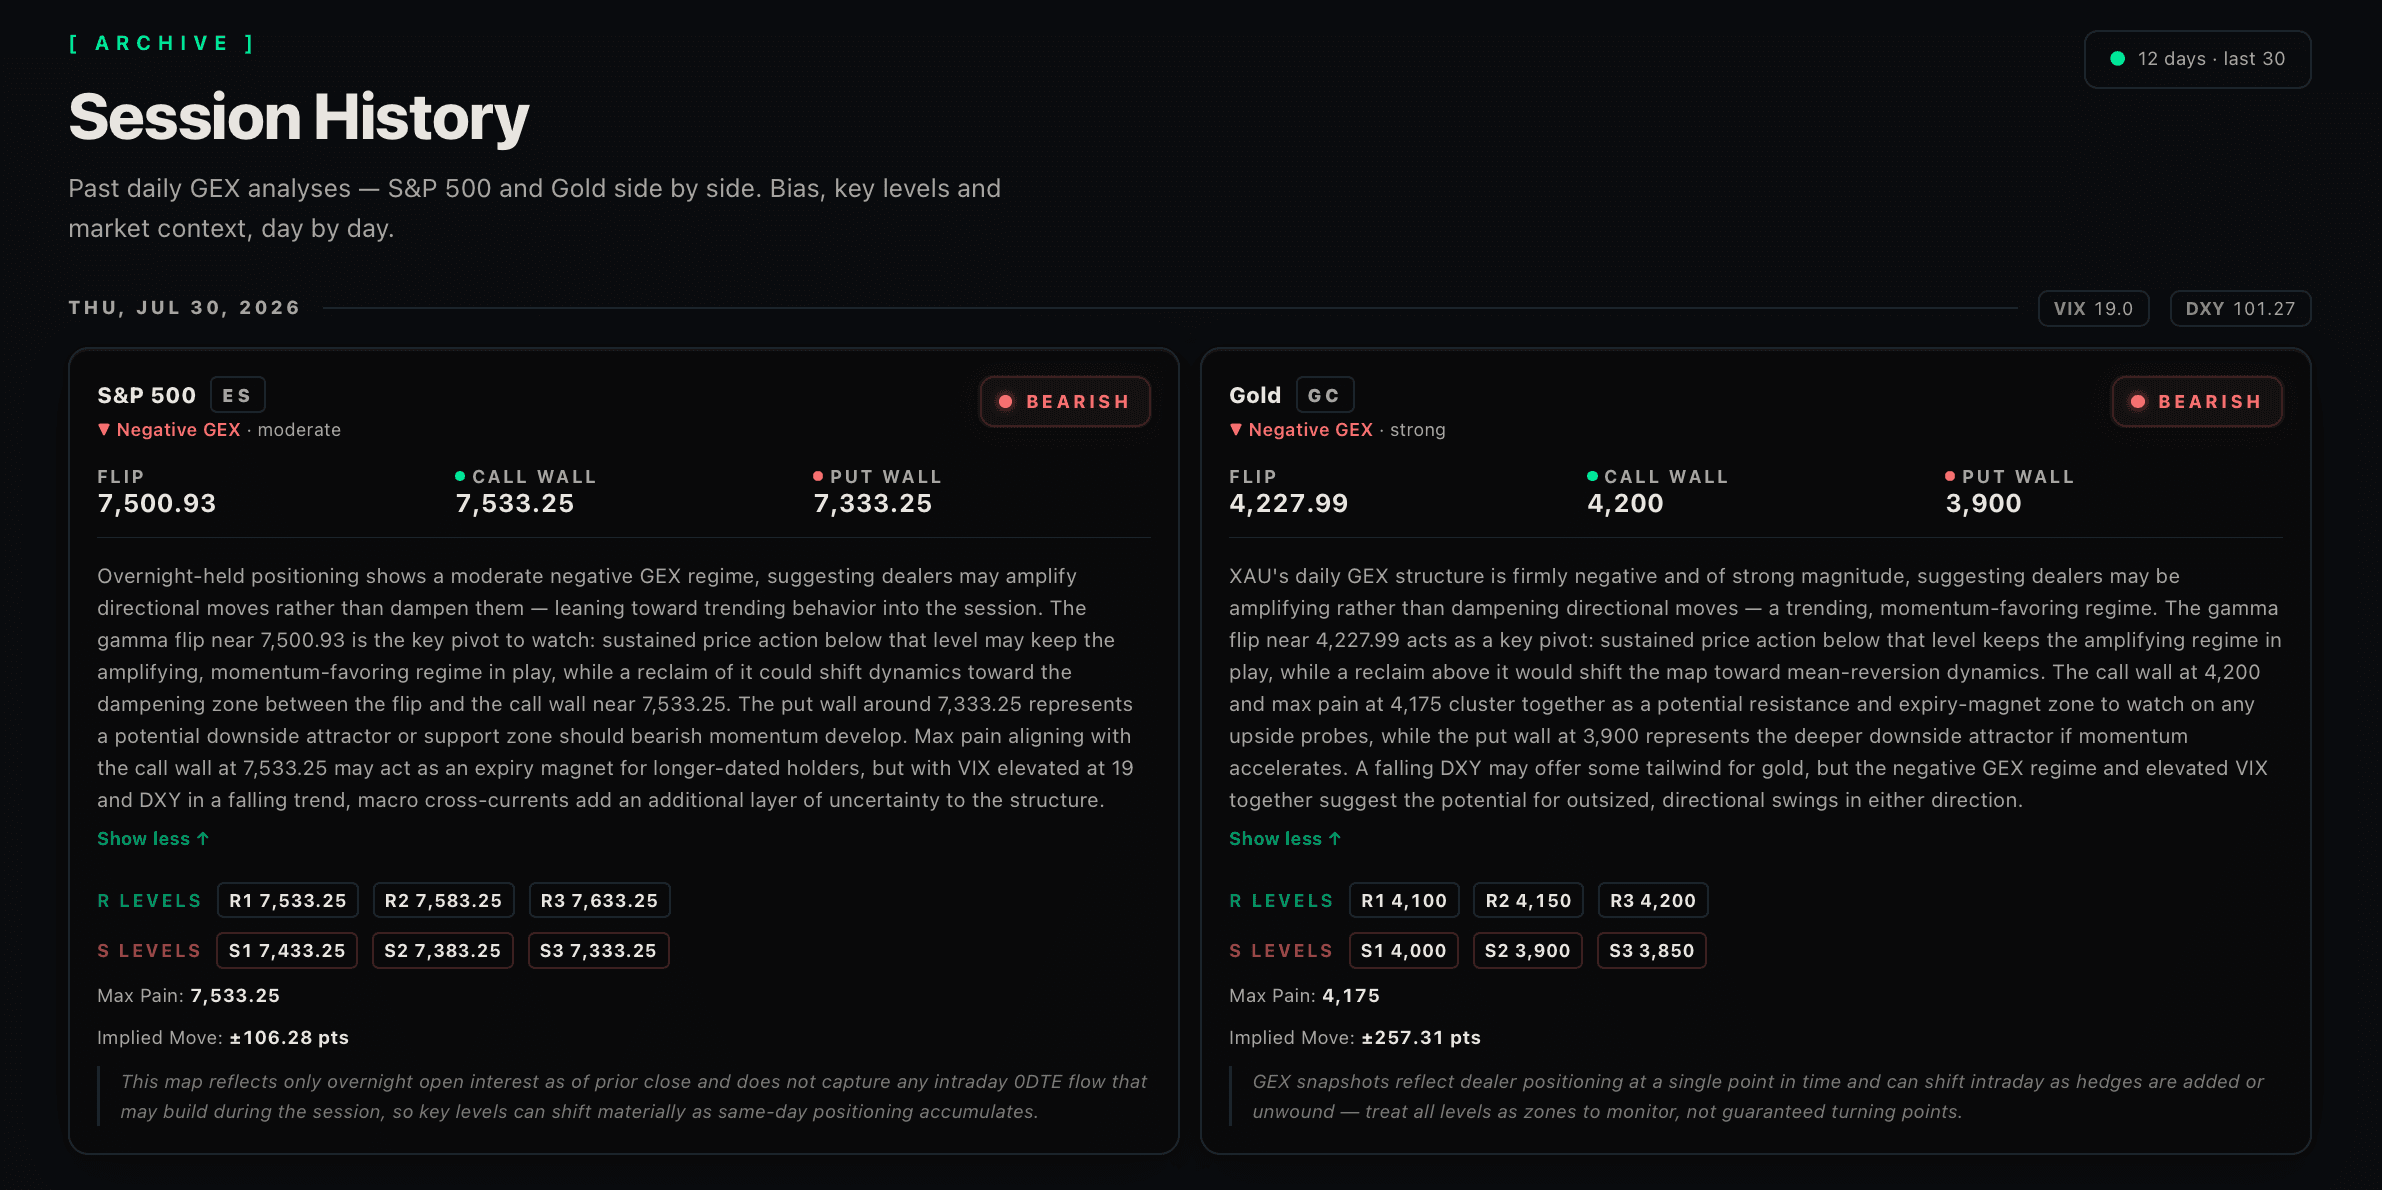
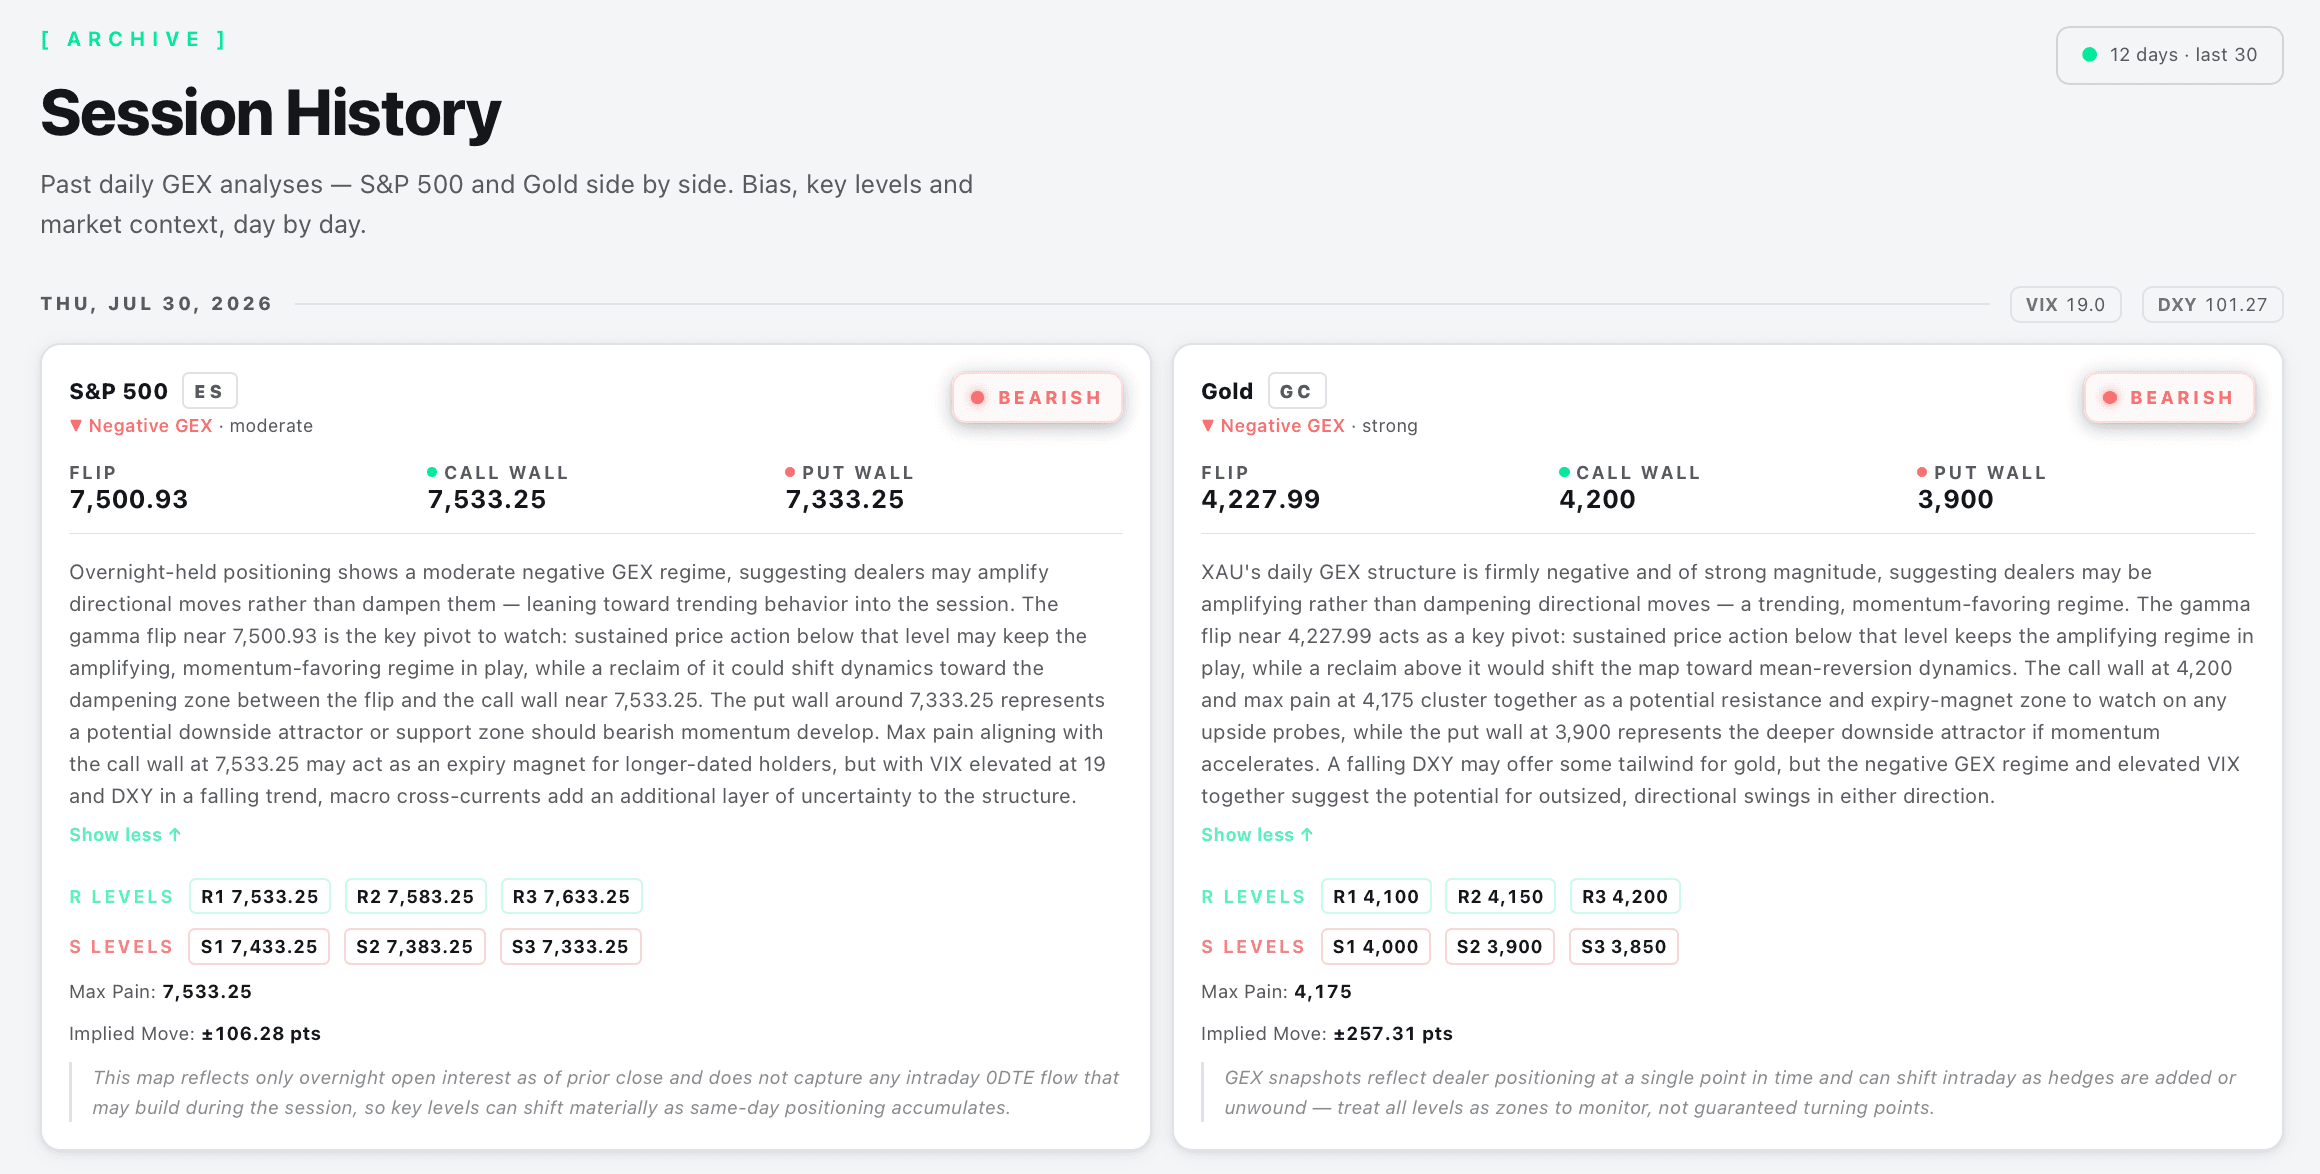
Every past GEX snapshot stays in the archive — go back and see exactly where the walls were on any session. Compare price behaviour against the structure and build real pattern recognition.
Every past GEX snapshot stays in the archive — go back and see exactly where the walls were on any session. Compare price behaviour against the structure and build real pattern recognition.
[ INSIGHTS ]
A spreadsheet row cannot capture what a trade felt like. A visual card can — and that difference is what makes pattern recognition possible.
Read article→Every week, DepthLevel's AI reads your trade history and surfaces what it found in your dashboard. Here is what it looks for — and why human review misses the same things every time.
Read article→Both platforms have a journal, R-value tracking, AI, and education. The real difference is one layer that TradeZella does not have — and whether that layer matters depends entirely on what you trade.
Read article→[ BY THE NUMBERS ]
One platform. Daily analysis, structured education, and a trade journal that builds your edge automatically.
11
Curriculum Modules
From fundamentals to advanced GEX & order flow
83
Structured Lessons
Coming soon — order flow · footprint · GEX · VWAP · delta
Daily
GEX + AI Analysis
SPX and Gold — delivered before every open
$0
To Get Started
Free during beta — no credit card required
[ BETA · FREE ACCESS ]
No payment, no credit card, no commitment. Join now and explore the full platform free during beta. Founding Members lock in $19/month — forever.
Already signed up? Log in →
WHAT YOU GET NOW
Founding Member spot. PRO launches at $39/month — but Founding Members pay $19/month, locked forever.
[ FOUNDING MEMBERS ]
We're launching PRO at $39/month. The first 100 people to join lock in our founding rate of $19/month for as long as they stay — even after we raise prices to $49 and beyond.
No payment now. We'll notify you when PRO launches.
[ FAQ ]
Yes. DepthLevel is fully free during the beta. No credit card, no payment, no commitment. You get daily GEX analysis, the AI market briefing, the Trade Journal, session history, and the full curriculum — all free while we're in beta.
DepthLevel is a trading education and analysis platform built for SPX and Gold futures traders. Every session you get a GEX-based liquidity map and AI market briefing before the open — plus a curriculum that teaches you how to read it all yourself.
How institutional positioning shapes price movement. GEX mechanics, order flow, footprint charts, liquidity zones — and how to read them before the session opens. Specifically built around SPX and Gold futures.
Yes. The curriculum starts from zero. Basic financial literacy helps but isn't required. The goal is to take you from not knowing what a footprint chart is to reading institutional order flow with confidence.
A built-in tool that logs every trade with R-value, setup tag, and playbook assignment. Win rate, avg R, equity curve, and profit factor are calculated automatically. MT4/MT5 and cTrader auto-sync via EA — trades appear in your journal the moment they close.
GEX (Gamma Exposure) shows how options market makers are positioned across the options chain. It reveals where they're likely to hedge — which creates predictable support and resistance levels. DepthLevel calculates this for SPX and Gold every session.
ATAS is the platform the course is built around — it provides the most powerful order flow and Level 2 data tools available. You can follow along without it, but you'll get the full benefit with it.
Level 2 data shows the real-time order book — the bids and asks placed by institutional players, banks, and hedge funds. Reading it lets you see where large participants are positioned before price reacts.
Yes. The methodology is universal. That said, the course and daily analysis focus on SPX and XAUUSD specifically, so you'll build the strongest edge on those two instruments.
No. DepthLevel is a trading education and market analysis platform. Everything here is for informational and educational purposes only — not financial advice, not investment advice, and not a signal service. We teach you how to read the market yourself. What you do with that knowledge is your decision.
Founding Members — everyone who joins during beta — pay $19/month, locked forever. After the founding period closes, PRO goes to $39/month. Join now and your rate never changes.
Yes. Discord is at the center of the platform — daily analysis discussions, session alerts, and community interaction all happen there.
The platform works smoothly on mobile browsers. Native iOS and Android apps are on the roadmap.
[ BETA IS OPEN ]
No credit card. No payment. Join the beta now, explore the full platform, and lock in your Founding Member spot before PRO launches.
Join the Beta — It's Free →Already signed up? Log in →
[ FOLLOW US ]
Stay in the loop.
Market analysis, trade breakdowns, and platform updates — follow us for daily content.